Driving Adoption of Innovative Solutions
REAL-TIME WASTEWATER ANALYSIS IN FOOD AND BEVERAGE PROCESSING
Wastewater related risks can generate significant costs to a business.
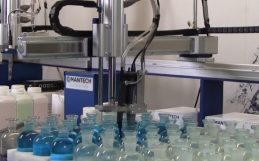
Overview Water is an integral input and vital strategic resource for the Ontario Food and Beverage Processing Sector. Water plays a variety of diverse and convergent functions. It is used for heating and cooling, blending, washing and rinsing, conveying, cleaning and sanitation – as well as being a vital product ingredient.
However, the use of water inevitably leads to the generation of wastewater that must be managed in an economical and environmentally responsible way.
To proactively achieve this, food and beverage processing companies (hereinafter referred to as “processors”) will have to develop and maintain an understanding of wastewater within their operations – what it is, where and how it is generated, as well as its composition and volume.
With this information as a starting point for change, processors will then be positioned to address the underlying issues and root causes. Given that current and future wastewater related risks can add significant costs to a business, minimizing or eliminating these will be critical to the future economic success of the food and beverage sector
“The value of the rapid test is to ensure a company is in compliance and, able to quickly react, when they are not.” – Robert Menegotto, President and CEO, MANTECH Inc.
The “Knowledge Gap”
To make informed decisions and improve their practices, processors must have accurate and timely data on their wastewater composition, sources and volumes.
This information will allow the processor to:
- Identify and prioritize opportunities to improve their water use and ingredient management practices and therefore reduce the volume and contaminant strength of their wastewater.
- Develop a strategic plan to evaluate, design and implement operational practice improvements, supported as necessary by practical and affordable management options.
- Initiate useful discussions with external solution providers and consulting firms on mitigation and management options that reflect their operations
Unfortunately, the majority of SME food and beverage processors not only do not have this information, they do not know how to properly collect and use the information.
In some areas of Ontario, regulatory agencies will undertake periodic sampling throughout the year as part of their enforce – ment activities to ensure compliance with discharge composition limits. However, the sampling protocol used may not align properly with the variability of a processor’s wastewater composition as influenced by operations. Consequently, the resulting analytical data may not be at a level of accuracy and timeliness to meet a processor’s operational needs.
The outcome of this “knowledge gap” is continuation of the status quo with many processors unable to effectively address their wastewater issues, and therefore accepting wastewater issues as a cost of doing business.
Why Does it Matter?
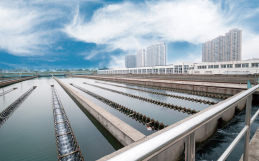
For a large percentage of Ontario food and beverage processors, the wastewater that leaves the facility will enter a municipal sanitary sewer system and end up at the local municipal or regional wastewater treatment plant (WWTP). These plants are designed to treat “residential strength” wastewater that does not exceed certain contaminant concentrations.
When the wastewater from a food and beverage processor exceeds these concentration limits, it is referred to as being “over-strength”. The municipality incurs increased costs to treat this wastewater. To offset this, municipalities will charge the processor an additional rate (referred to as a “surcharge”), and in some cases, will also issue fines.
If processors can stay on top of and effectively control what enters the wastewater stream within their facility, they can reduce their water related risks and resulting costs.
Regulatory costs are not the only financial impact of overstrength wastewater. High wastewater strength is also an indication of inefficient ingredient use and lost product. This impacts the bottom-line through lost revenue and wasted input costs, respectively.
The challenge is “how” to obtain accurate, real-time data.
Changing the Game
If actionable data is the key to effective wastewater management by food and beverage processors, they need wastewater information that is both accurate and frequent (real-time or near real-time). The challenge is “how” to obtain this data. Some real-time data such as pH is easily obtainable and can be inexpensively measured. The challenge is obtaining data on the organic concentration or “loading” of their wastewater. Traditionally, the only way in obtaining this information has been to collect samples for analysis by an external laboratory.
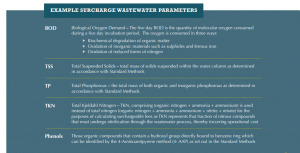
Biological Oxygen Demand
A high BOD level indicates that the wastewater contains elevated amounts of dissolved and/or suspended solids, minerals, and organic nutrients containing nitrogen and phosphorus. Each one of these materials represents a particular “contaminant of concern” to a regulator when wastewater is discharged to a sanitary sewer or to the environment.
However, it is not feasible to determine and measure the concentration of every different organic material in the wastewater. Instead, a method called biological oxygen demand (BOD) is used that provides an indirect measure of the concentration of the combined organics in water. For food and beverage processors, these organic compounds are primarily due to the presence of ingredient and product losses that end up in facility drains.
Such organic compounds are easily decomposed or “oxidized” by bacteria. These bacteria consume oxygen as they metabolically break down the compounds into smaller and smaller molecules. The amount of oxygen consumed during this process over a given period of time is known as the biochemical oxygen demand or BOD.
Within a lab, this is measured by the quantity of oxygen (mg/L) consumed by micro-organisms during a five-day period under controlled conditions. The resulting five-day BOD (BOD5) is a measure of organic material strength in wastewater commonly used by regulators for compliance monitoring and enforcement.
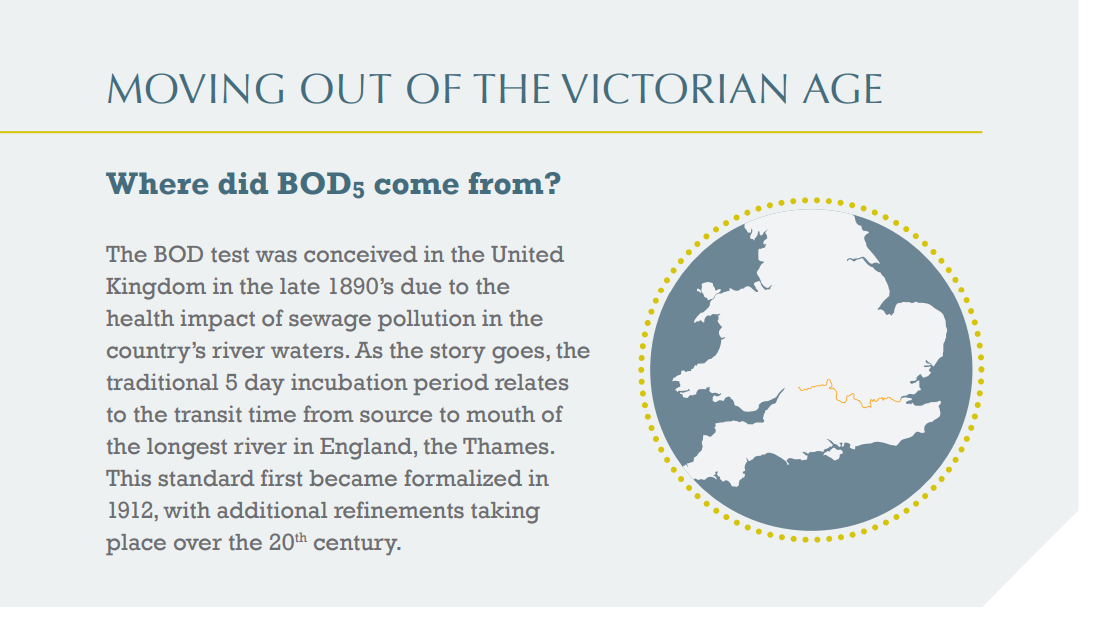
The Barrier of Time
While it is a common and widely used test, the BOD analysis is rarely done on-site. Instead, a sample is usually taken and then shipped to an accredited laboratory for analysis. The timeline to take the sample, ship it to a laboratory for analysis and receive the results can be between two and three weeks. Because of this long turn-around time, the BOD analysis provides “historical data” on the wastewater composition.
What is required is an approach where the wastewater information can be analyzed and reported in a short enough timeframe to allow a processor to make the connection between the results and their facility operations. Since the BOD method is incapable of producing results in such a timely manner, an alternative is needed if processors are to take steps to effectively manage their wastewater and mitigate rising treatment costs and compliance risks.
COD – the BOD Alternative
There is another analytical approach based on oxygen demand, called chemical oxygen demand (COD). Like BOD, COD is an indirect measure of the amount of organic compounds in water. The difference is that COD provides a measure of what can be chemically oxidized in the water. Instead of using bacteria to biologically decompose the organic compounds, COD uses a strong oxidizing agent to react with nearly all of the organic and inorganic compounds in the wastewater. As the COD analytical method is oxidizing more components within the wastewater, COD values are always higher than BOD values. Unlike BOD, the traditional method for COD analysis takes hours instead of days.
The Relationship between COD and BOD5
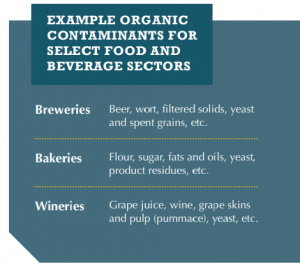
As noted, COD and BOD are different for a given wastewater source due to the differences between the test methods. However, the ratio between BOD and COD is fairly consistent. It must be noted though that for wastewater generated from different sources or operations (i.e., a bakery, a brewery or a winery), the COD/BOD ratio can widely vary reflecting the differing compounds within the different wastewaters and how these are detected by the different test methods.
Processors need an alternative to BOD to effectively manage their wastewater.
While the use of the COD measurement for wastewater compliance monitoring is slowly increasing, regulatory agencies still largely use BOD to monitor wastewater being discharged to sanitary sewers and the environment. However, for processors, COD is emerging as an option for process control measurements due to the shorter time frame to obtain test results. Yet, the traditional method to obtain COD results is not without its major challenges, which to date have been barriers to the adoption of COD as a viable tool for processors.
Traditional COD Versus Real-Time COD
While traditional method COD has the potential to be a significant improvement over BOD as an indicator and tool to improve wastewater management practices, there are issues or barriers that prohibit its widespread use. These include the hazardous and toxic chemicals used during the oxidation process, and the need for trained analytical chemists to be on staff to conduct the analytical test.
With these as a barrier to doing the COD analyses on-site, the traditional COD process ends up being similar to BOD as samples must be gathered and sent to a lab with a turn-around time of 1-2 weeks from sampling to the time when results are received. Despite the traditional COD test method being significantly faster than the BOD method, the time-delay due to use of an external laboratory means that the COD method is not much more useful than the BOD method.
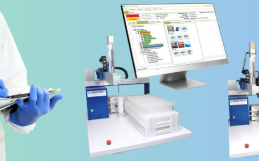
Fortunately, new “near real-time” COD analytical methods have recently become available, which address the traditional COD barriers. The new approaches utilize non-chemical methods to oxidize the samples and therefore eliminate the need for trained analytical chemists on staff. They also address the time issue in two ways: the first is near real-time methods take minutes rather than hours; and second, there is no need to send the samples to an external laboratory. In fact, some of these new systems include automated sampling and analyses that may not require technician involvement. Taken all the benefits together, these “rapid result” COD systems allow processors to obtain a continuous picture of “what is going on” in their wastewater systems.
The Pilot Projects
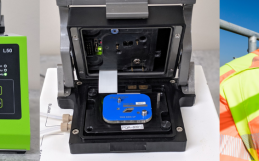
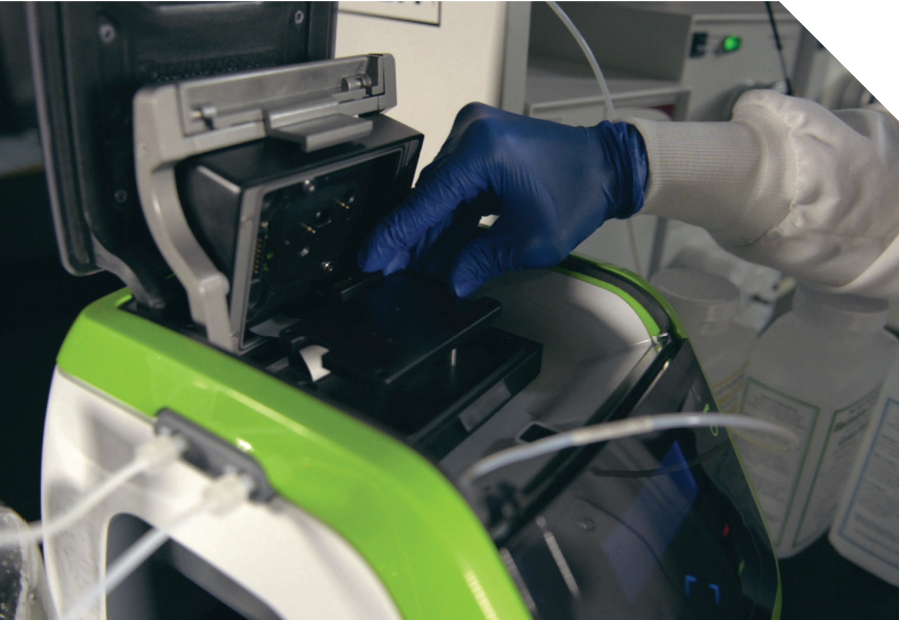
Given the potential benefits associated with the application of these new real-time COD systems in the food and beverage processing sector, several pilot projects were conducted to assess performance and determine the feasibility. A COD system representative of this new approach was identified and selected: the PeCOD® analyzer developed by MANTECH Inc.
A PeCOD® analyzer unit was tested in three different food and beverage facilities; a winery, a bakery and a brewery, to undertake “real-time” measurement and analysis of effluent wastewater. The installed analyzers were configured to automatically collect and test the samples over a demonstration period of four to six weeks per facility. To compare and confirm the PeCOD results, a second set of effluent samples were regularly collected over the same period and sent for independent laboratory analysis. Laboratory analyses included standard wastewater effluent parameters, as well as potential method interferences such as chloride.
The objectives of these pilot projects were to:
- Characterize the facilities’ wastewater composition;
- Demonstrate the value of real-time COD analysis at different food and beverage facilities;
- Compare on site real-time analysis with both standard laboratory BOD and standard laboratory COD analysis;
- Establish correlation ratio relationships between laboratory results and on-site real-time results for each facility;
- Determine if there were wastewater composition issues or interferences that could be a barrier to adoption of real-time COD analysis.
Results
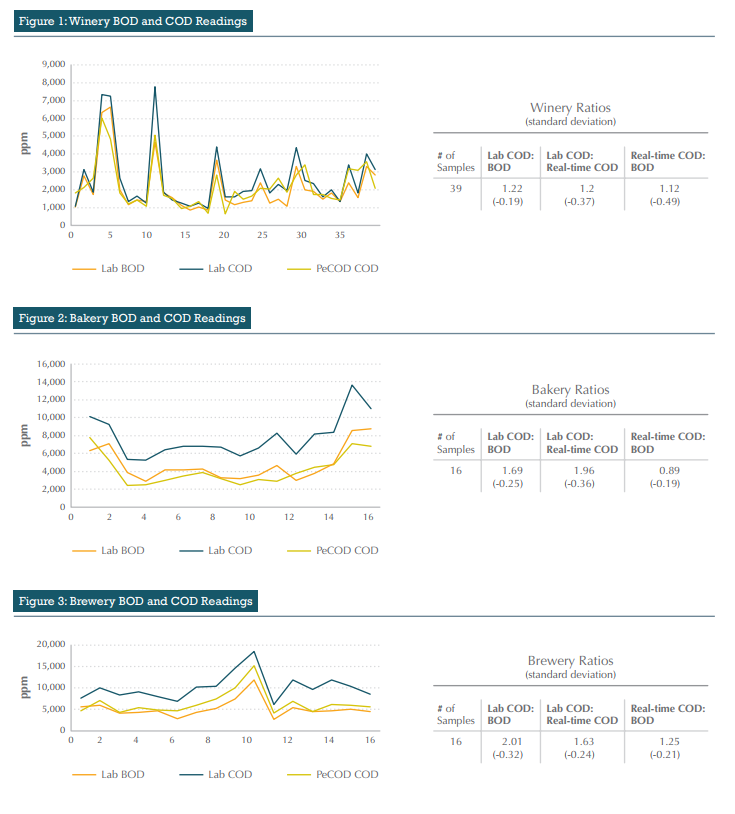
For the three processing operations, the trending relation – ship between BOD 5 and COD was fairly consistent across the demonstration period as shown in Figures 1, 2 and 3 on page 16. The consistent relationship can also be represented through correlation ratios.
The laboratory tested COD to BOD correlation ratio is calculated by taking the COD concentration and dividing it by the BOD concentration for the same sample. Similarly, readings from the PeCOD analyzer, correlated by time and date to the laboratory BOD samples, can be used to calculate real-time COD to BOD ratios. They can also be used to calculate realtime COD to laboratory tested COD. This ratio can show where differences may exist between the PeCOD analytical method and the one used by the test lab.
When comparing the results across the three different processors, the ratio of COD to BOD varied widely. This was expected, due to the differences in ingredients used and products produced in each facility, which eventually ends up in the wastewater.
The bakery reported the highest laboratory COD to PeCOD COD ratio, which could be attributed to the high wastewater content of biological macromolecules, such as protein, lipids and cellulose. The nature of these materials may have impacted their full oxidation within the unit and therefore not been fully detected by the PeCOD ®. In addition, unexpected high concentrations of chloride were reported in both the bakery and the brewery effluents at 960 ± 136 mg/L and 939 ± 410mg/L, respectively.
Chloride is the most common interference of the dichromate method used to determine the laboratory COD analyses and can impact test results. Chloride also causes interference for the PeCOD ® method, though at higher chloride concentrations than what have been reported on the host sites. That being said, the interference behaves differently between the two approaches with chloride acting as a positive interference for the dichromate method and a negative interference for the PeCOD®. Therefore, the presence of high chloride concentrations in the effluent might have impacted both the laboratory and PeCOD COD ratio.
How to use these ratios
Once the relationship has been established for a processing facility, the PeCOD COD test can be used for monitoring, process control, and estimated BOD. This can be done by converting the PeCOD COD result into an equivalent BOD result using the correlation ratio. This simple relationship allows real-time COD measurements to be used to generate accurate BOD estimates as needed.
Using the winery as an example: Assume that the PeCOD analyzer generated a COD value of 5,000 ppm. Based on the correlation data, the COD/BOD ratio is 1.12. Therefore, the correlation ratios would allow the winery to predict a BOD5 value of: 5,000 mg/L PeCOD COD/1.12 = 4,464 ppm BOD (predicted).
Various correlation ratios derived from the pilot tests have been established for each facility (Table 1).
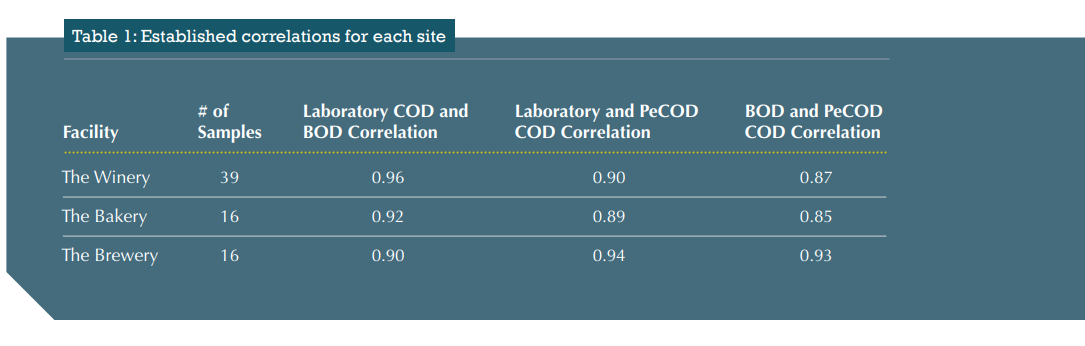
For a processor interested in adopting near real-time COD analysis in their facility, they would first need to establish the correlation ratios on their own or in partnership with their solution provider. Once that is done, they can use those ratios to develop their own wastewater management information based on near real-time COD analysis.
Key Takeaways from the Demonstration Projects
The pilot projects demonstrated the potential of “real-time” COD analysis at food and beverage facilities. The key outcomes were as follows:
- Confirmed that “real-time” COD measurements can be used to provide accurate BOD estimates within minutes. This outcome was supported through the establishment of consistent correlations between BOD and both laboratory as well as “real-time” COD results in each of the three facilities that were part of the pilots.
- Showed that near real-time COD measurement for the food and beverage sector can be part of a strategy to improve water and wastewater management through access to “real-time” wastewater data. This information can enable facility operators to better optimize their processes and manage their wastewater composition, costs and risks.
Next Steps
These pilot projects can be viewed as a first step to demonstrate the value of real-time wastewater analyses in Ontario’s food and beverage processing sector.
BLOOM is planning to build on this foundation and carry out additional initiatives to:
- Incorporate near real-time COD measurement into an integrated wastewater management solution. This will involve embedding the technology into treatment solutions as a key process control tool. This will allow food and beverage processors to proactively manage process upsets as well as the risks of unknowingly discharging over-strength wastewater.
- Build a suite of compelling case study examples of the business benefits resulting from the long-term collection and use of water data within a processor’s operation.
“You have to measure it to manage it. This provides food processors with the accuracy of a laboratory test without the need for a lab facility or highly trained technician.” – Michael Fagan, Senior Vice President, BLOOM
Download the full PDF here.