- How do inorganic compounds affect PeCOD® COD determination?
The following tables summarize the impact of a range of common inorganic anions and cations on the determination of COD using the PeCOD® technique. You can download this FAQ as a pdf document at this link.
For each inorganic species, solutions containing 0, 20, 50, 100, 250, 500 ppm (by mass) of the anion or cation, 60ppm COD (as sorbitol) and 1M LiNO3 (containing 20ppm COD spike) were prepared and analyzed, unless otherwise stated. Therefore, the below ion concentrations represent the concentration IN THE CELL (i.e. if analyzed in a different range, the interference levels may vary due to different electrolyte dilution effects).
Anions Formula Remark Ammonium NH4+ No interference for NH4+ ≤ 500 ppm Note: Similar results are obtained for Ammonia
Carbonate CO32- No interference for CO32- ≤ 500ppm using chloride resistant sensor Chlorate ClO3– No interference for ClO3– ≤ 500ppm Chloride Cl– No interference for Cl– < 200 ppm. COD reduced by up to 20% at Cl- levels of 500ppm using Chloride resistant sensor. Other halides (F-, Br-, I-) would be expected to behave in the same manner Nitrate NO3– No interference, NO3– can be used as PeCOD electrolyte Nitrite NO2– No interference for NO2– ≤ 500ppm Perchlorate ClO4– No interference, ClO4– can be used as PeCOD electrolyte Phosphate PO43- No interference for PO43- ≤ 500ppm Sulfate SO42- No interference for SO42- ≤ 500ppm Sulfite SO32- Interference for SO3 ≥ 20 ppm, giving COD high by 90% at 250 ppm SO32- Sulfide S2- Interference for S2- > 0 ppm, giving COD high by >100% at 50 ppm S2- Cations Formula Remark Aluminum Al3+ No interference for Al3+ ≤ 500ppm Calcium Ca2+ No interference for Ca2+ ≤ 500ppm Chromate Cr3+ Interference for Cr3+ > 2 ppm, giving low COD Ferric Iron Fe3+ No interference for Fe3+ ≤ 500ppm Ferrous Iron Fe2+ Interference for Fe2+ > 100 ppm, giving low COD Magnesium Mg2+ No interference for Mg2+ ≤ 500ppm Potassium K+ No interference for K+ ≤ 500ppm Silver Ag+ Interference for Ag+ > 10 ppm, giving low COD Sodium Na+ No interference for Na+ ≤ 500ppm Zinc Zn2+ No interference for Zn2+ ≤ 500ppm - What is the cost per sample using the PeCOD?
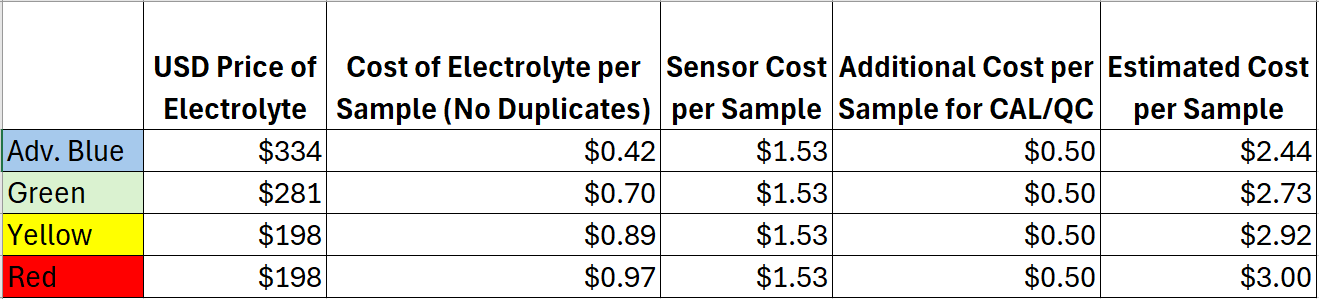
On average, the cost per sample can range anywhere from $2.44-$3.00 per sample. The cost per sample varies depending on the COD/BOD range and the number of samples analyzed, as this affects consumable usage such as calibrant, electrolyte and sensors. In general, the cost per sample decreases with an increase in the number of samples. There are several reasons for this, one being that the sensor should be replace monthly, therefore running more samples per month will yield a better return on sensor usage. In addition, the PeCOD® requires a daily calibration; by running more samples per calibration users save on consumable costs associated with calibrant. There are no disposal costs for the PeCOD, whereas disposal costs accumulate via the traditional dichromate method with every sample vial.

*All prices in USD
- How is the PeCOD® COD/BOD Analyzer calibrated?
Calibrations are comprised of 6 different stages. The first stage is called the “Normalization Phase” and lasts 100 seconds. During this time, the LED strength is adjusted to maintain a baseline electrical current of 20 mA. This is performed on the blank solution, containing range specific electrolyte and COD free deionized water. Once the LED is set, oxidation of the blank solution will occur. This is comprised of 3 stages, visualized by 3 distinct curves. The stages are known as the Burn-In, Pre-Burn, and Oxidation of port B. The blank acts as a zero reference for the calibration based on the charge generated from the DI and electrolyte mixture. The area under the curve is used to quantify charge. Once the Port B stages have completed, the Port A stages will begin. The calibrant and electrolyte mixture is introduced across the TiO2 sensor, where similar Pre-Burn and Oxidation curves are generated. The concentration of the calibrant is determined based on the sample COD/BOD range. Once the specified number of calibrations have completed, the calibrant solution can be run as a sample (referred to as a QC check). It is expected that the COD result will be + / – 5% of the standard COD/BOD value. To view an example of the stages of a PeCOD® calibration, view our video here.
- How do I replace the sensor in my PeCOD® Analyzer?
Open the top plastic door by pushing down firmly on the front centre of the door until a “click” is heard, then release the door. Open the PeCOD analyzer module by pressing firmly down on the fixed bar, and lifting the front latching bar (should unlatch), then lift up the PeCOD sensor lid. Remove the old sensor by lifting it off of the pins and place the new sensor on the same pins with the “THIS SIDE UP” surface (blue side) facing you.
- How long will the PeCOD® Electrolyte, Calibrant, and Standard solutions last?
Both Calibrant and Standard Solutions are good for one year after they are made. Electrolyte has a shelf life of two years after it is produced. All labels have the expiry date in the box just above the MANTECH logo.
- How long does a sensor last in a PeCOD® Analyzer?
Sensor lifetime depends on a number of factors including frequency of use, storage conditions, nuances of certain sample matrices, and time between uses. Sensors are expected to last for approximately 150 runs (this includes samples, calibrations and QC checks), or for a minimum of 3-4 weeks when used consistently day after day. When analyzing higher sample concentrations (especially red range) the sensor life expectancy can be shorter, ranging from 60 – 150 total measurements depending on sample strength.
In cases where the PeCOD is not being used frequently (2 weeks or more between each set of samples), the sensor’s life expectancy timeline can be extended through the proper application of long-term storage recommendations. MANTECH recommends that when the PeCOD is not expected to be used for more than 2 weeks at a time, that Ports A and B should be primed with air, then the sensor be removed from the analyzer and stored in a dark, dry location with the sensor window face-down (white foam facing up). This is because moisture and light exposure are known to have a degrading effect on the sensor, reducing the lifespan of use. At the same time, the PeCOD Electrode Block should be removed and stored with DI water filling the internal liquid channels. This can be achieved by covering one of the channel outlets with laboratory tape, then use a syringe to inject DI water into the channel until it overflows out of the hole you are injecting into, and then cover that hole with tape as well.
When the PeCOD is being used more frequently, MANTECH recommends leaving the sensor in place with DI primed through Port A between analyses and running at least one QC check per day to keep the sensor “active” even on days that you are not expecting to run samples. This ensures the best day-to-day conditions for the sensor leading to the longest possible lifespan of use. On days where you are planning to run samples, a new calibration is recommended when the daily QC check does not fall within the +/- 20% passing range. It is always important to prime Port A and Port B x3 times with the proper reagents when going from DI water storage to the daily QC check and samples.
For more information, read MANTECH’s technical bulletin here.
- How do I change the number of calibrations and QC checks the PeCOD does during each QC regime?
Click ‘File’ in the top left corner, and select ‘Preferences’. The ‘General’ tab will pop up, select the ‘QC Regimes’ tab. Here you can see how many calibrations, QC checks, and recalibrations the PeCOD® will preform for the ‘Startup (Daily) Regime’. To see the other regimes, select the ‘Startup (New Sensor)’ tab, or the ‘QC Routine’ tab in the second row. To edit the number of calibrations or QC checks, click the arrows beside the numbers to choose how many of each the PeCOD® will perform.
- How do I store my electrode block?
If only storing the electrode block for a short period of time (less than 4 weeks), rinse DI water through the PeCOD and leave the electrode block inside. Make sure all of the sample has been washed through by priming Port A several times. If storing for more than 4 weeks, put DI water through the PeCOD and then remove the electrode block to store outside the PeCOD. Flush the channels with 20-30 mL of DI water before pushing through about 10 mL of NaCl, leaving the channels filled. Tape the ends of the channels to ensure no leaks or crystallization occur. For more information, read the storage instructions here.
- What is the difference between the L50 and the L100?
The L50 is the newer, more cost efficient model of the PeCOD. It uses the same method, reagents, and software as the L100. Improvements were made with the fluidics and space requirement in the L50 model. For more information, see the news section.
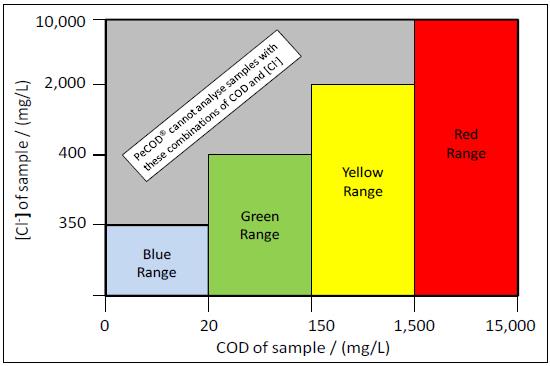
- What is the allowable COD/chloride concentration combinations for PeCOD analysis?
There are limitations to ensure that, after dilution with electrolyte, the chloride concentration will be <200mg/L. This means that the allowable chloride concentration of the original sample varies depending on the COD range (as illustrated below) since each range has a different ratio of sample to electrolyte. For more information, read MANTECH’s technical bulletin here.

- What are the COD/BOD ranges for the PeCOD and what are the mixing ratios?
There are 4 COD ranges for the PeCOD. The advanced blue range is the lowest range and analyzes samples up to 25mg/L with a mixing ratio of 3:1 (sample to electrolyte). Green is the second lowest range and measures up to 150mg/L with a mixing ratio of 1:1. The yellow range determines COD up to 1,500mg/L with a mixing ratio of 1:9 and the red range can analyze samples up to 15,000mg/L and has a mixing ratio of 1:49. For more information, read MANTECH’s technical bulletin here.
- Does PeCOD conform to regulatory standards?
The PeCOD conforms to regulatory standards such as the ASTM International Method D8084, the Ministry of Environment, Conservation and Parks, Ontario (MECP) method E3515, and the Health Canada Guidance on drinking water.
The ASTM International method for photoelectrochemical oxygen demand is approved for measuring organics in freshwater sources and treated drinking water. More details about this method can be viewed here.
The Ontario MECP method E3515 replaced the standard dichromate methods due to the fact that no harmful chemicals are used in the PeCOD method. This method now includes PeCOD as an approved alternate COD method in the Municipal and Industrial Strategy for Abatement (MISA). The MECP method can be viewed here.
- What does the Class 3B warning label on the PeCOD COD Analyzer head mean?
The PeCOD COD Analyzer has a warning label on the analyzer head “DO NOT OPEN ANALYZER LID WHILE IN OPERATION” and “CAUTION: CLASS 3B INVISIBLE LASER RADIATION. AVOID EXPOSURE TO BEAM.” See Image 1.

Image 1: Warning label on analyzer lid
There are two normal LED lights (one red, one green), and one (invisible) Class 3B UV LED laser. See Image 2.
The red LED light is an error indicator and is a non-harmful light. The green LED light is the power indicator and is also a non-harmful light.
The Class 3B UV LED laser is a catalyst for TiO2 oxidation of organics. Class 3B UV LED lasers are harmful to your health, however, there are safety measures put into place to avoid exposure to this invisible UV LED laser on the PeCOD COD Analyzer. The PeCOD has an automatic laser shut off built in so the laser will turn off when the analyzer lid is opened. This lid should not be tampered with or modified as the Class 3B laser is hazardous to your health.

Image 2: Analyzer head with 2 (two) normal LED lights, and 1 (one) 3B UV LED Laser
- Do I need to filter my samples for PeCOD analysis?
Samples must be filtered prior to peCOD analysis to ensure that no particulates greater than 50 micron (um) are primed into the peCOD. Particulates larger than 50um can cause clogging, which can lead to damage of the internal fluidics of the machine. To prevent clogging and ensure proper sample preparation, MANTECH has a Sample Filtering Guide for PeCOD Analysis.
For pulp and paper and wastewater applications, MANTECH recommends using a 35um polyethylene (PE) syringe filter. These filters can contribute trace amounts of organics, which are negligible for wastewater applications. For drinking and source water applications it’s important to use a filter that does not contribute organics to the filtered sample. One of MANTECH’s research partners has recommended a 0.45um polyethersulfone (PES) filter; however, other filter types may also be acceptable, if no organics are contributed by the filter. Since these applications traditionally see less particulates, having a smaller pore size filter hasn’t shown an impact on the peCOD results.
- What are the PeCOD electrolyte and calibrant solutions composed of?
The PeCOD electrolyte solution is mainly composed of a low-concentration lithium nitrate solution. The PeCOD calibrant and check standard solutions supplied by MANTECH are composed of sorbitol. These solutions contain a trade recipe preservative that allow for the longer shelf life, compared to solutions prepared manually. Calibrant and check standard solutions prepared manually, following the PeCOD Standard Recipe, can be used for up to two weeks.
View the PeCOD electrolyte slurry SDS here.
View the PeCOD calibrant slurry SDS here.
View the PeCOD QC check standard slurry SDS here.
View the PeCOD blank slurry SDS here.
- How should COD samples be stored?
MANTECH recommends storing samples in the laboratory fridge vs preserving samples. If you do choose to preserve your samples, use H2SO4 to adjust the pH of your samples to ~2.
- What pH range can the PeCOD method measure in?
pH Range: 4.0 – 10.0 (after mixing with electrolyte)
The peCOD method requires that the pH of a sample AFTER being mixed with electrolyte must be between 4 – 10. To determine if a sample must be pH-adjusted, mix the sample with peCOD electrolyte at the proper mixing ratio for your COD range, then test the pH of the mixture.
For example, the sample may have a pH of 3.0, but then after preparing with electrolyte, the pH is in the required range, therefore, it is acceptable for immediate peCOD measurement.
If samples have been preserved in acid, they should be neutralized using sodium hydroxide prior to analysis to avoid a low reading, as well as damage to the sensor. When the sample pH is below 4, the photocatalytic oxidation at the TiO2 sensor is affected, leading to poor reproducibility and charge values below theoretical expectation. Below a pH of 2, the TiO2 displays instability. When the pH is above 10, the charge measured for the reference and sample solution yield lower than expected values, again caused by interference at the TiO2 sensor. Sulphuric acid should be used to lower the pH of samples with a pH of 10 or more.
- What is the primary mechanism of PeCOD chemistry?
The primary driver of the peCOD method chemistry is advanced oxidation induced by photocatalysis with Titanium Dioxide (TiO2). Pure TiO2 is only photo-active at wavelengths below 380 nm. This is because a certain amount of light energy is required to bump the electrons around and cause the behaviors that we associate with photocatalysis. The UV LED in the PeCOD® COD Analyzer operates at a peak wavelength of 365 nm, with a minimum 360 nm and maximum 370 nm, ensuring that efficient photocatalysis is achieved.

- How does the PeCOD Analyzer calculate COD?
The PeCOD Analyzer performs advanced oxidation on a small volume of sample. As the reaction proceeds, electrical charge is generated proportional to the oxygen being consumed. The PeCOD analyzer captures this generated charge, plotting the output current from the reaction over time as shown below. The area under the curve generated by plotting current over time is proportional to the COD of the sample. A blank charge is also determined for each sample, and subtracted from the total charge to ensure accuracy.
View the detailed overview of PeCOD technology and calculations here.

- How does the PeCOD benefit water treatment optimization?
A common benefit of peCOD implementation for this application is optimization of coagulant dosing.
The traditional method up to this point has been consistent dosing based on laboratory testing results (jar testing is a very common method of developing coagulant dosing requirements). They then increase their dosing for events that they know to cause NOM spikes. The problem is they often don’t know the extent of the NOM spikes, so they increase their dosing to what has been deemed as ‘enough’. More often than not this is over-dosing, not really causing downstream issues but incurring more cost than is needed for these events. However, when the extra dose is not enough and they under-dose, NOM gets through and reacts with the disinfection chemicals creating DBPs.
The missing ingredient is knowing when these NOM spikes occur, and to what extent. The events could be anything from seasonal variation based on climate to rapid spikes from storm events, but the benefit of knowing is the same. Plants that have enough funding to do so monitor UV and TOC online, however research has shown that this is not enough. peCOD is another piece of the NOM puzzle and is truly the more important measure when looking at how NOM will react and be affected by treatment. If you know the COD of the NOM coming in and can match it to known dosing requirements, you minimize the possibility of DBPs forming.
The speed and ease of use of the peCOD is also key here, you are placing this knowledge directly in the operators’ hands, rather than having it be a result they wait to get back from an external lab. When they can truly understand the technology and it’s value, it has a secondary effect of getting them more involved with optimizing the treatment processes. We see with numerous cases (mostly in WWTPs at this point) this occurring, where they get the peCOD for measuring one or two points then realizing the benefit it can have through monitoring their whole plant.
- Why does my PeCOD plot more than one curve during calibration and sample analysis?
For calibration, the PeCOD® Analyzer goes through the following phases:
- Normalization Phase. This is where the PeCOD® Analyzer is adjusting the LED lamp output, trying to achieve a baseline of 20µA.
- Burn-In Phase (port B). This is where the pre-mix blank solution is brought into the sensor cell. It is oxidized to remove contaminants from the cell.
- Pre-Burn Phase (port B). This is where a new aliquot of pre-mix blank solution is brought into the sensor cell. This phase removed more contaminants from the cell and conditions the cell for the pre-mix blank.
- Oxidation (port B). A new aliquot of pre-mix blank is brought into the sensor cell and is oxidized. This value is used in the peCOD calculation. The area under this curve is used to calculate the ‘blank charge’, which corresponds to the C value determined by each calibration. This is the small amount of COD contributed by the electrolyte reagent, which is then subtracted from all future COD analyses to give the final COD result.
- Pre-Burn (port A). A new aliquot of pre-mix calibrant solution is brought into the sensor cell where it is oxidized. This removes contaminants from the cell and conditions the cell for the pre-mix calibrant.
- Oxidation phase (port A). A new aliquot of pre-mix calibrant if brought into the sensor cell. This value is used in the peCOD calculation. The area under the curve is used to calculate the reference charge, which is used with the blank charge to determine the relationship between charge and COD. This corresponds to the M value determined by each calibration.
For sample analysis, the PeCOD® Analyzer goes through the following phases:
- Burn-In phase (port B). The pre-mix blank solution is brought into the sensor cell and is oxidized. This removed contaminants from the cell.
- Pre-Burn phase (port A). An aliquot of sample is brought into the sensor cell and is oxidized. This removes contaminants from the cell and conditions the cell for the sample.
- Oxidation phase (port A). A new aliquot of sample is brought into the sensor cell and is oxidized. This value is used in the peCOD calculation. The area under the curve is used to calculate the charge generated by sample oxidation. The blank value will be subtracted from the sample value to determine the sample COD.
- How much bench space do I require for a typical PeCOD L50 set-up?
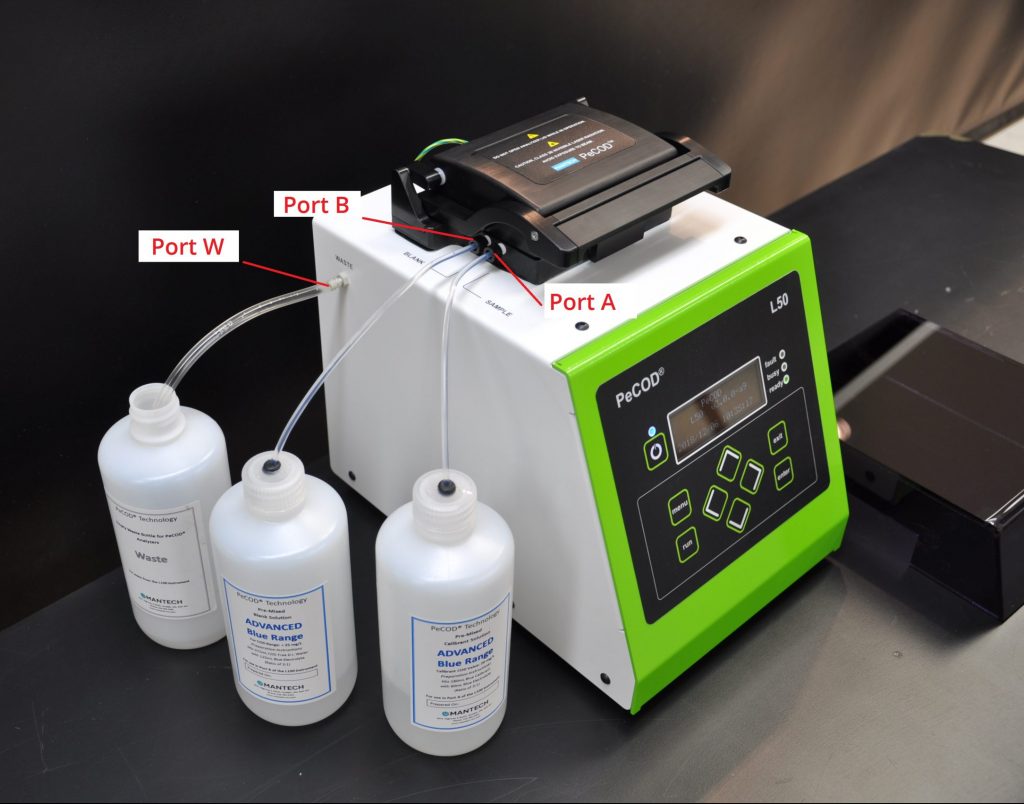
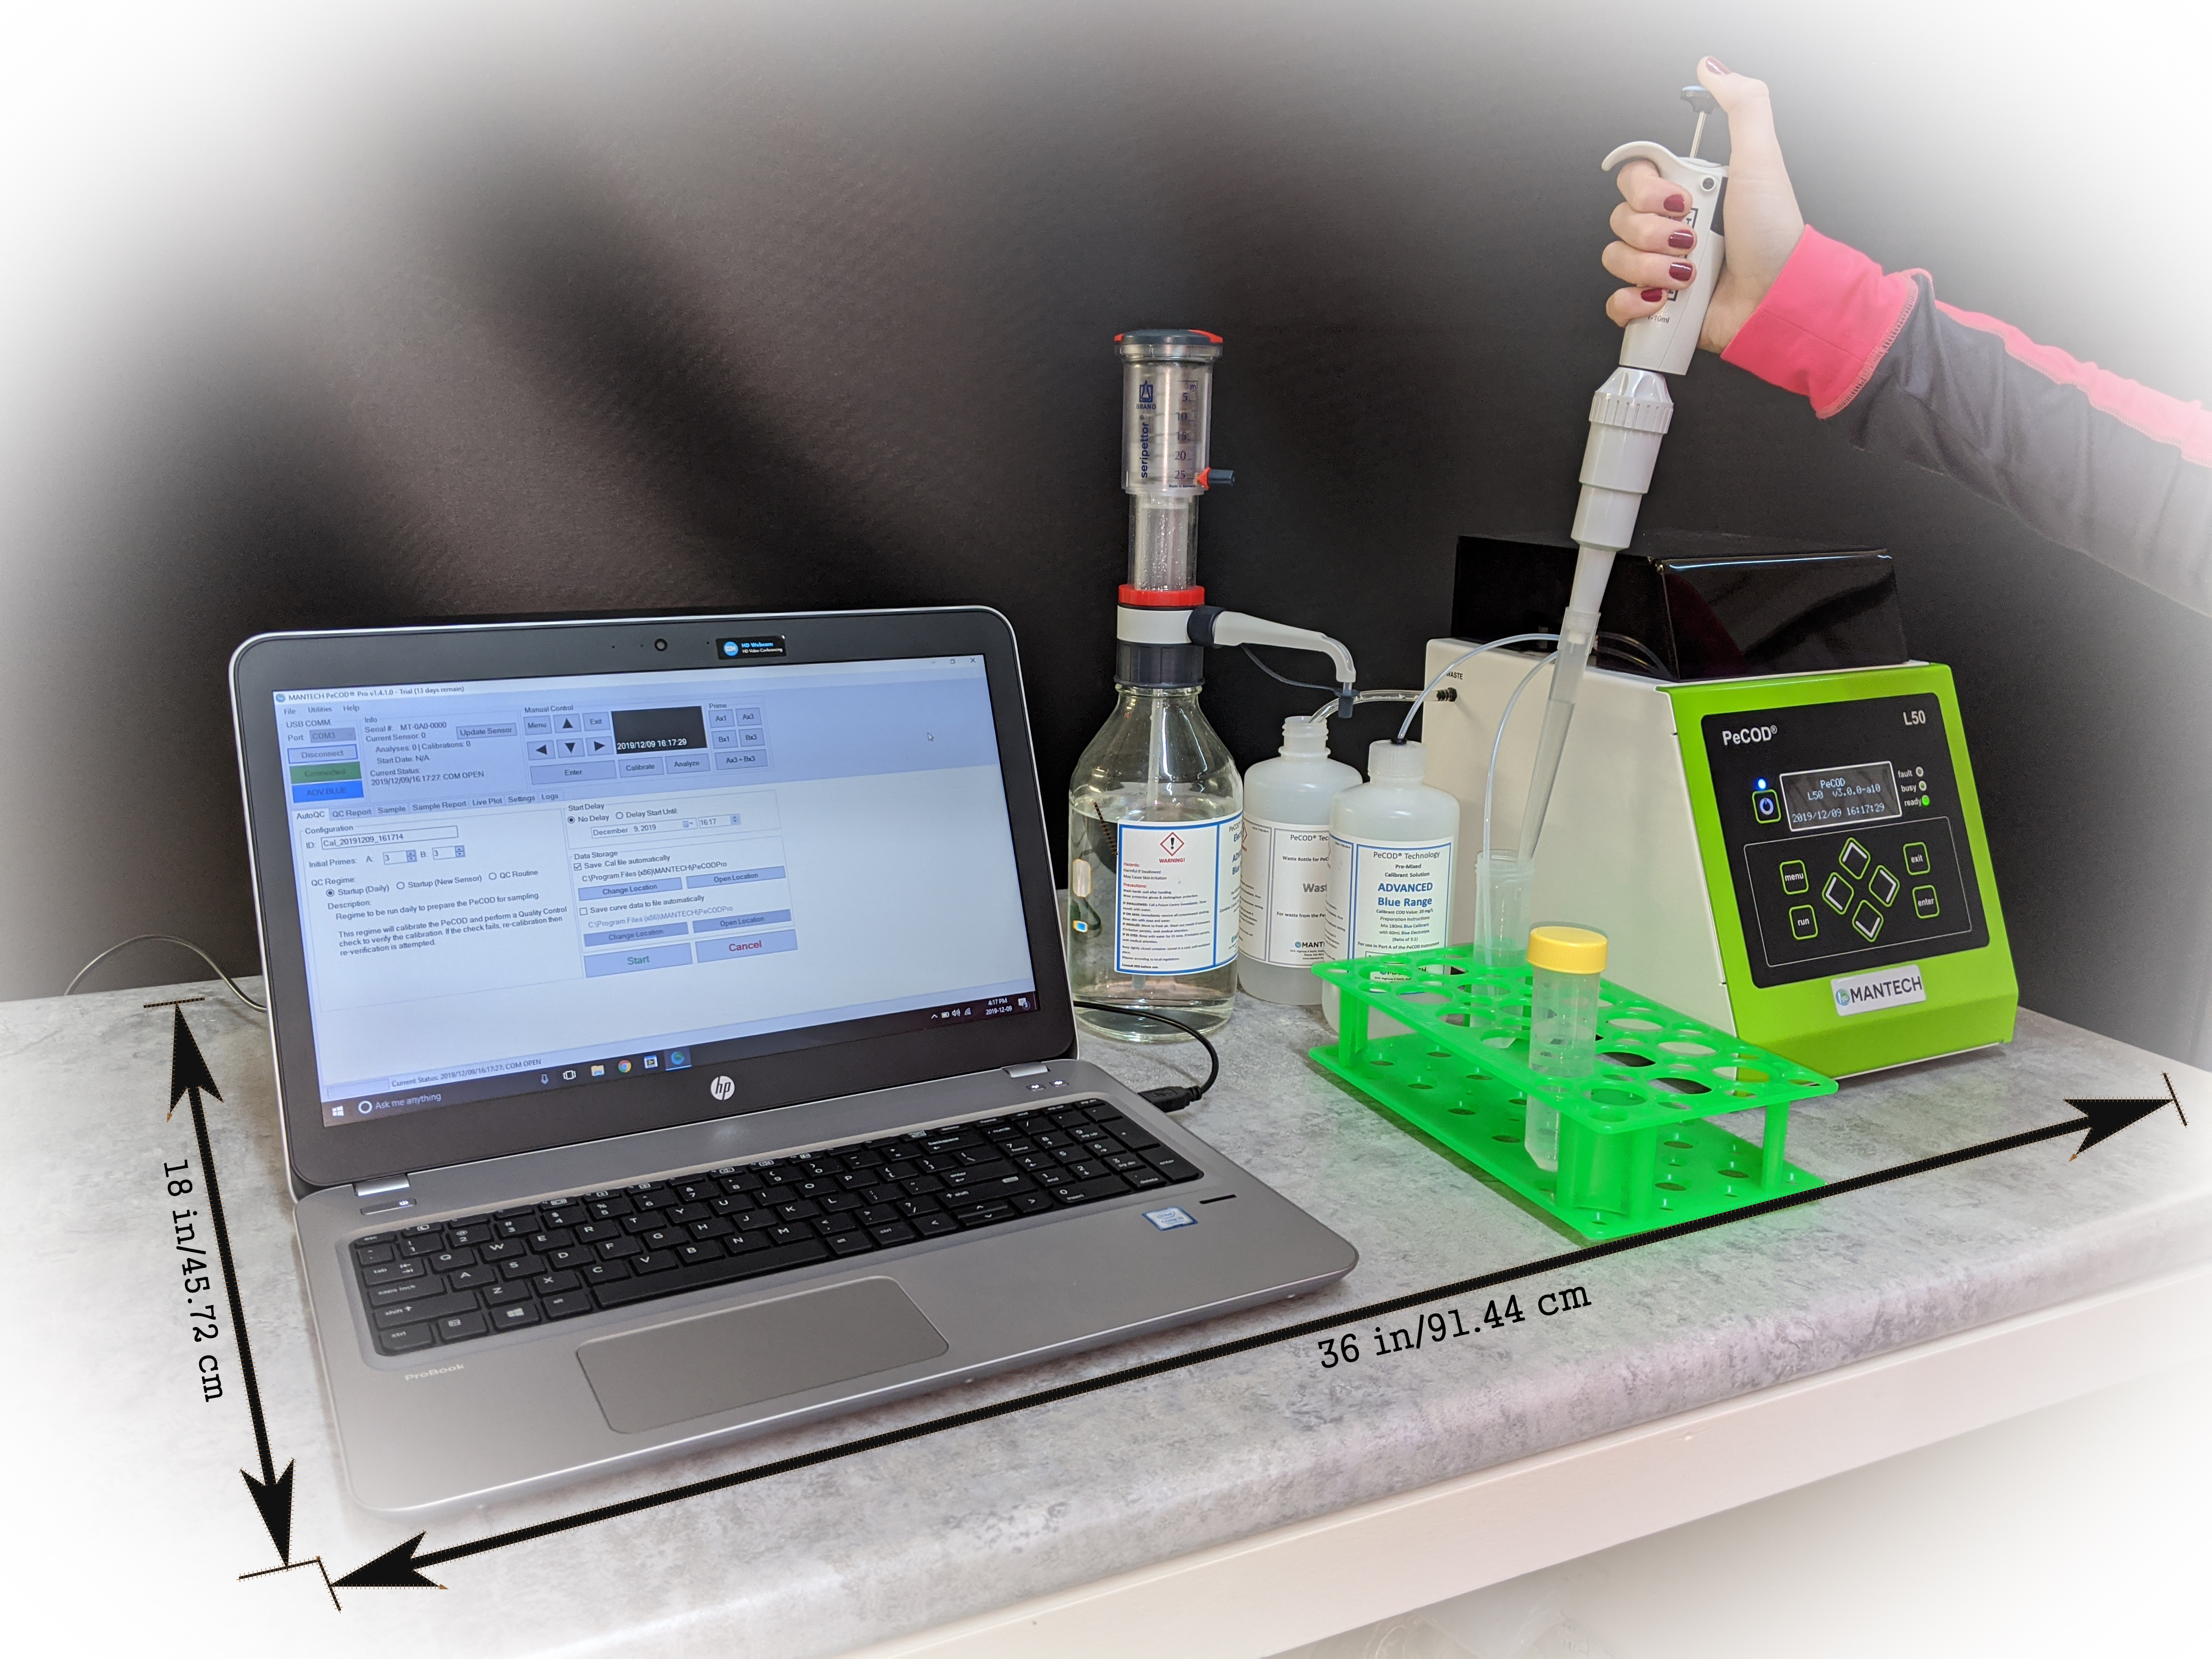
The typical benchtop L50 set up requires 36 inches x 18 inches of bench space, as shown in the figure below.
- What is the typical initial PeCOD shipping weight and dimensions?
An investment in the safe, green, and fast PeCOD Analyzer and method includes the PeCOD L50 Analyzer, starter kits, and consumables. This is typically packed in two cartons with the following weight and dimensions:
Box 1 (starter kits and consumables)
16” x 15” x 14”, 32lbs
41cm x 39cm x 36cm, 15kgBox 2 (PeCOD L50)
16” x 15” x 16”, 21lbs
41cm x 39cm x 41cm, 10kg - What is the difference between the benchtop and portable PeCOD?
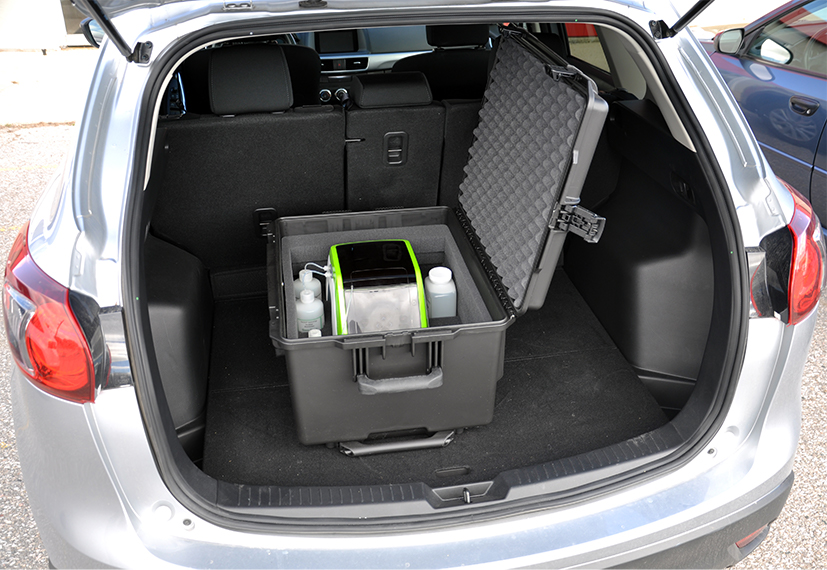
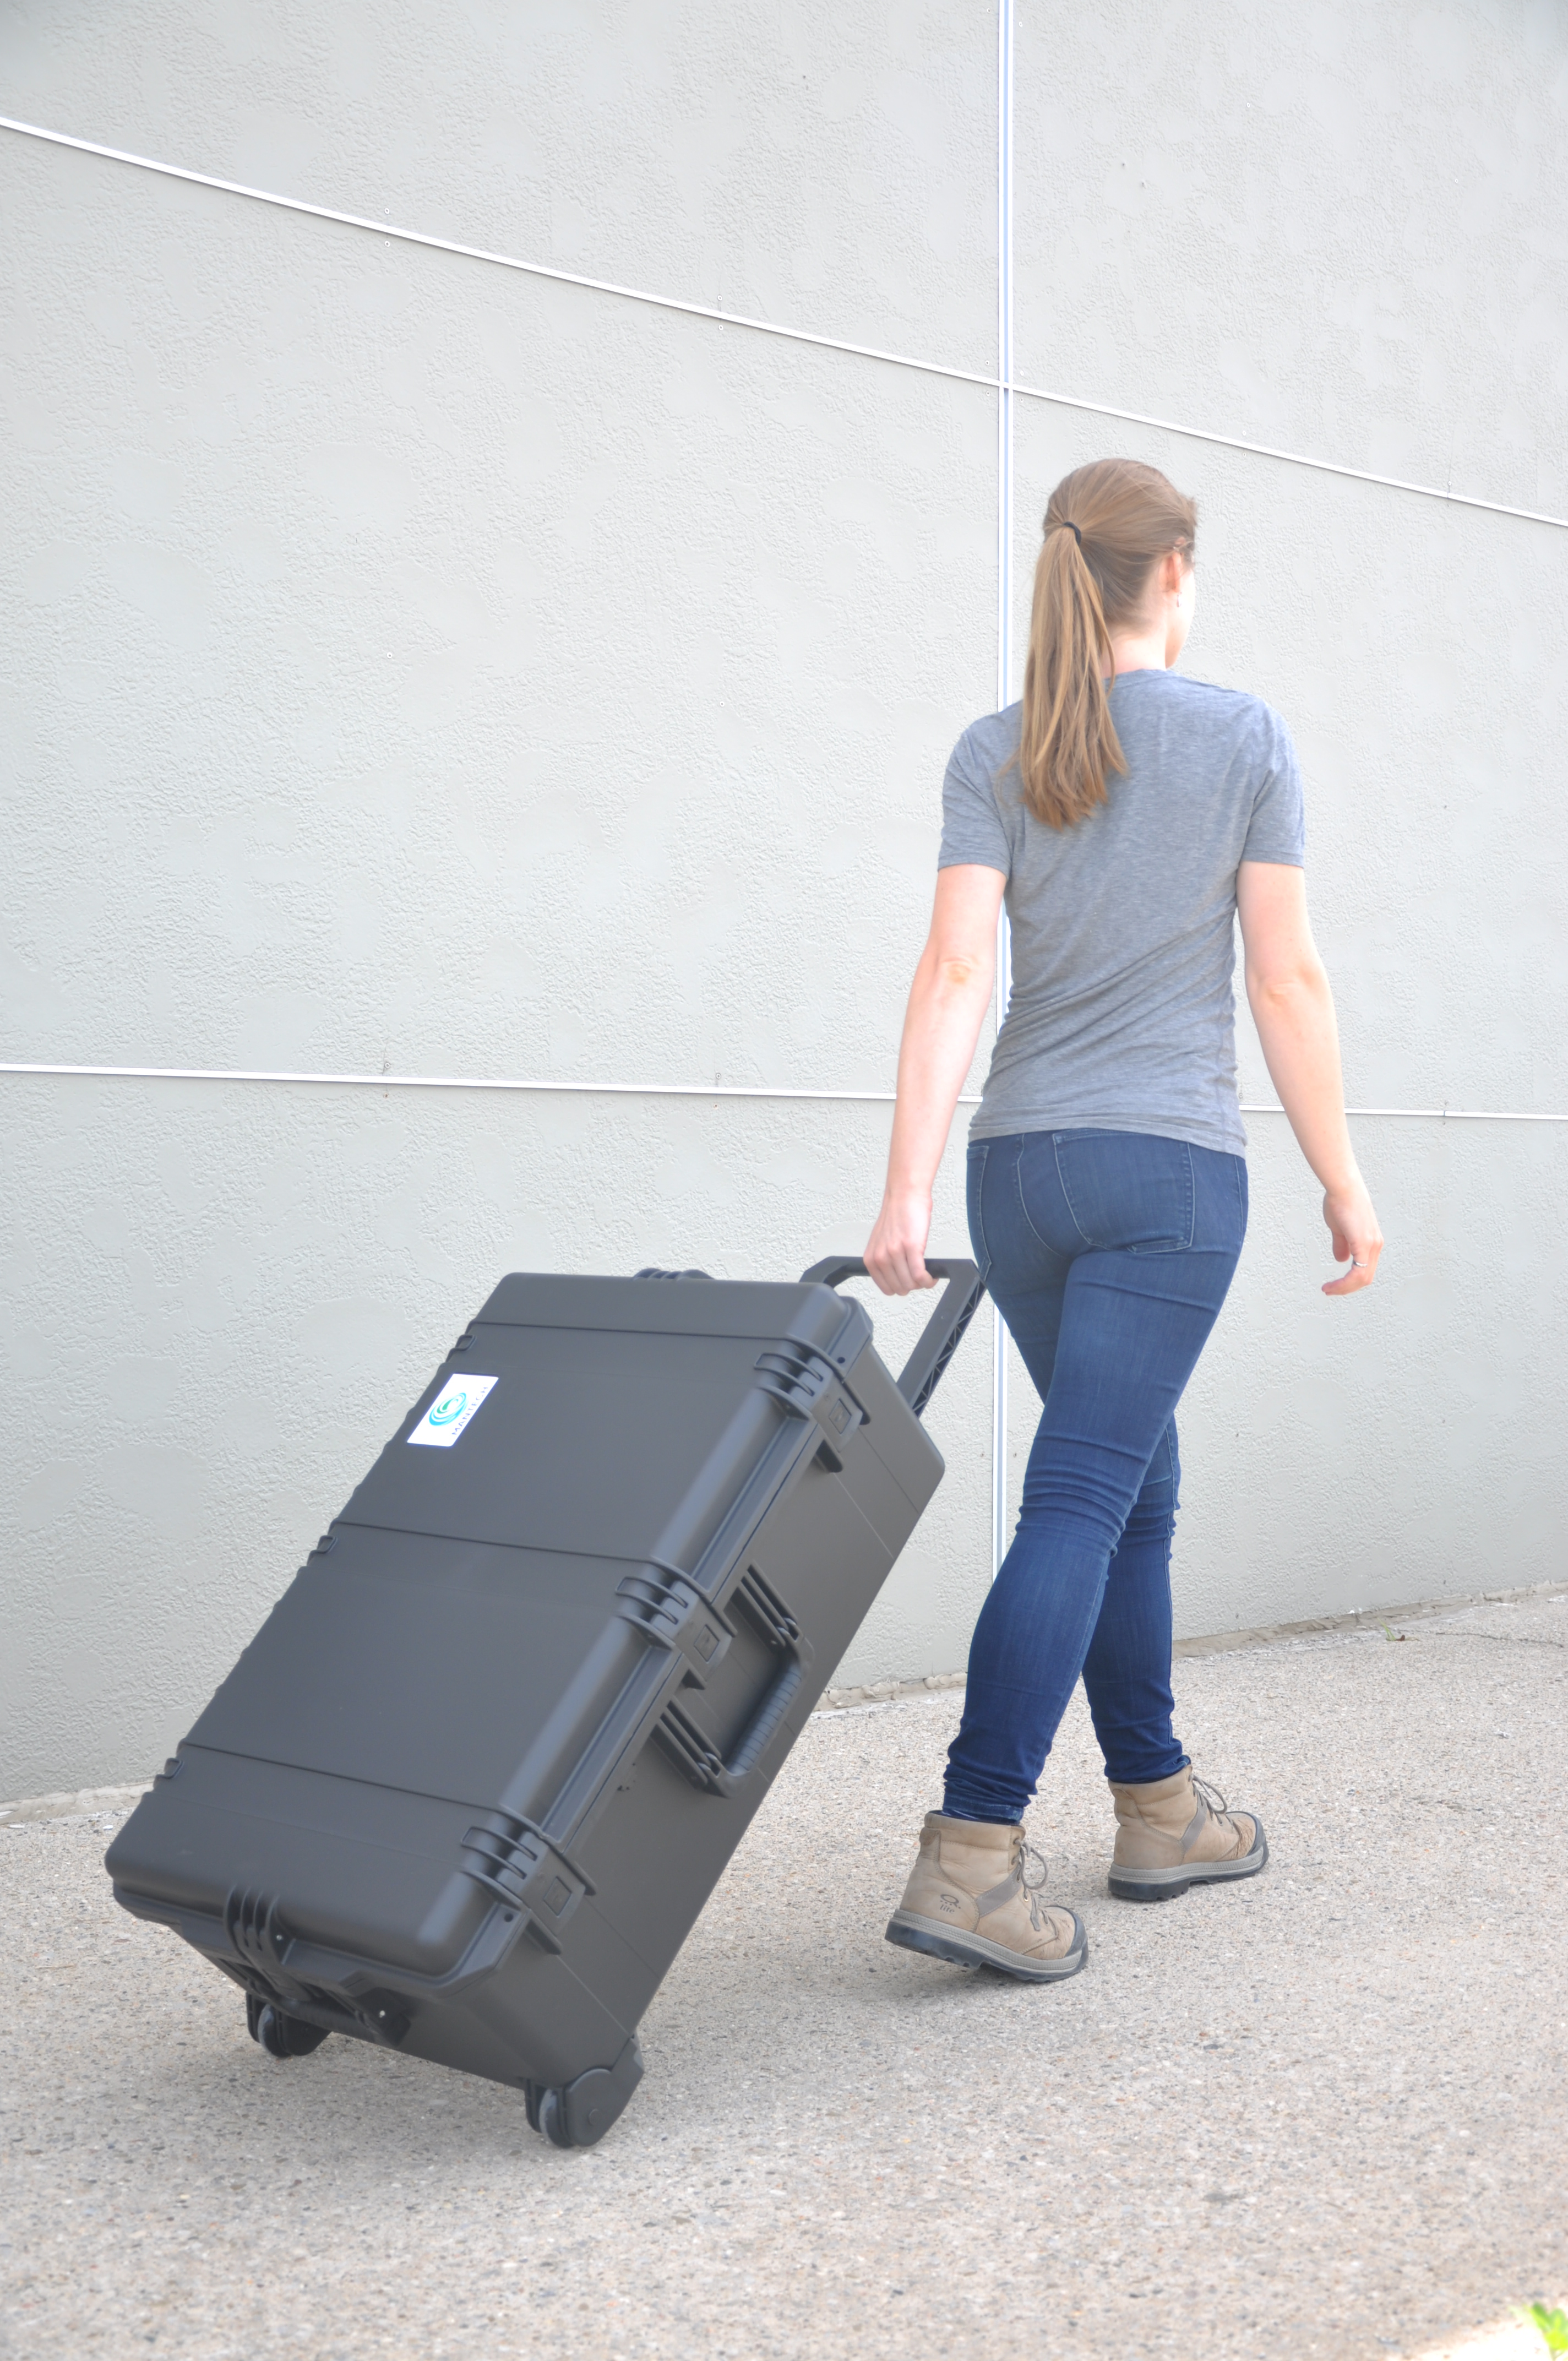
The L50 PeCOD® Analyzer is applicable for benchtop and portable use, with the incorporation of an external battery and carrying case. The L50 weighs less than 7kg and measures 280mm x 210mm x 260mm. Its rugged carrying case, equipped with wheels, makes it easy and safe to transport the unit between the field and the laboratory.

Person wheeling the portable peCOD carrying case.
- What is used as a quality check standard for PeCOD?
A separate standard produced by Sigma Aldrich is used for quality control testing of PeCOD systems. This allows for verification of results and ensures that the system in use produces trusted values. This secondary standard can be diluted into different concentrations, making its use applicable to all COD ranges of solution used with the PeCOD analyzer. The Sigma Aldrich SKU number for this standard is QC1130.
- What is the shelf life of a PeCOD sensor?
If left unopened and sealed in the package, PeCOD sensors have a shelf life of 12 months. Once opened and in use, sensors can be expected to last for approximately 1 month or 200 samples (whichever comes first).
- How do I store my PeCOD sensor?
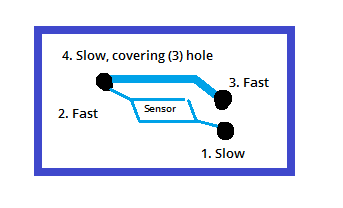
On a day to day basis, the PeCOD sensor inside the Analyzer head, in the same location as it is placed for operation. At the end of each analysis and calibration, the PeCOD primes the sensor line with blank solution to provide a clean environment similar to operating conditions for storage. An alternative to this is to prime DI water manually through Port A of the PeCOD at the end of a day’s operations.

When the PeCOD is not going to be used for some time, for example a week or longer, it is good to remove the sensor from the unit for long term storage. This is done by first removing the Port A and B tubes from liquid, then priming those lines with air. Then, press on the front latch to open the analyzer head and access the sensor. The sensor can then be lifted off the alignment pins. Once removed, it is important to use a syringe to “dry” the internal channels of the sensor. Fill a 10mL syringe with air, then press the syringe (without a tip) against the holes in the back of the sensor. Push the syringe down to push air through the sensor channels. Perform these steps on each of the holes in the back of the sensor, in the following order:

Once dry, place face down on a dry surface to finish the drying process. Next, place the sensor in a cool, dark place for long-term storage. The sensor packaging works as a suitable package for long term storage after properly drying the sensor.
- What happens if COD is high?
Higher COD levels mean a greater amount of oxidizable organic material in the sample, which will reduce dissolved oxygen (DO) levels. A reduction in DO can lead to anaerobic conditions, which is deleterious to higher aquatic life forms.
- What temperature should my PeCOD samples be analyzed at?
The temperature range that PeCOD samples should be analyzed is between 10 to 30°C. For samples that are outside of this temperature range, the addition of electrolyte (which is stored at room temperature) prior to analysis will help to bring the sample solution to an acceptable temperature range.
- How many PeCOD samples can be analyzed with the reagent starter kit I received?
New PeCOD Analyzer orders typically include a slurry reagent starter kit providing the consumables to run the PeCOD analysis. These kits consist of Electrolyte, Calibrant, and Secondary Standard slurry reagents. Electrolyte is the reagent that is mixed with each sample, therefore it is typically the reagent to be used up first, requiring the user to purchase more from MANTECH. It is useful to know on average how many samples can be run with the electrolyte provided in the standard reagent starter kits, therefore we provide this information below.
You will need to know the color operating range of your PeCOD (Adv. Blue, Green, Yellow, or Red). If you plan to run a single analysis per sample, use the left column for 10mL total volume. If you require duplicate or triplicate analysis per sample, use the right column for 20mL total volume. Depending on how many samples are run per calibration, these numbers may vary.
10mL Total Volume – Single Analysis 20mL Total Volume – Duplicate and Triplicate Analysis For Advanced Blue range (3:1): - 7.5mL sample required
- 2.5mL electrolyte required
- 2L electrolyte provided in starter kit
- 800 samples can be run
For Advanced Blue range (3:1): - 15mL sample required
- 5mL electrolyte required
- 2L electrolyte provided in starter kit
- 400 samples can be run
For Green range (1:1): - 5mL sample required
- 5mL electrolyte required
- 2L electrolyte provided in starter kit
- 400 samples can be run
For Green range (1:1): - 10mL sample required
- 10mL electrolyte required
- 2L electrolyte provided in starter kit
- 200 samples can be run
For Yellow range (1:9): - 1mL sample required
- 9mL electrolyte required
- 2L provided in starter kit
- 222 samples can be run
For Yellow range (1:9): - 2mL sample required
- 18mL electrolyte required
- 2L provided in starter kit
- 111 samples can be run
For Red range (1:49): - 0.2mL sample required
- 9.8mL electrolyte required
- 2L provided in starter kit
- 204 samples can be run
For Red range (1:49): - 0.4mL sample required
- 19.6mL electrolyte required
- 2L provided in starter kit
- 102 samples can be run
Number of samples that can be run with 10L bottle of electrolyte: - Adv. Blue range, 4000 samples
- Green range, 2000 samples
- Yellow range, 1111 samples
- Red range, 1020 samples
Number of samples that can be run with 10L bottle of electrolyte: - Adv. Blue range, 2000 samples
- Green range, 1000 samples
- Yellow range, 555 samples
- Red range, 510 samples
Note: 5x Electrolyte slurry packages are required for making up 10L. - How do I prepare my water/wastewater sample for PeCOD Analysis using a homogenizer?
The following steps will outline how to correctly homogenize a water/wastewater sample for analysis with the PeCOD.
- Homogenize the raw sample for 2 minutes. Ensure you are using at least 50mL or more of sample.
- Prepare the sample with electrolyte in the range being used. Click here for the correct sample-to-electrolyte ratio for each colour range.
– For example, if you are using yellow range, take 2mL of sample plus 18mL of electrolyte.
– If dilution is required, prepare the dilution first with the homogenized sample, then prepare with electrolyte. - Homogenize the mixture of sample and electrolyte for 1 minute.
- Place the PeCOD intake tube (Port A) into the sample and press run the analysis.
- Rinse the homogenizer in deionized water, turn on for 30s while in DI water.
- Spray down homogenizer with DI water using a laboratory bottle with nozzle (common lab squeeze bottles).
- Why did my PeCOD calibration fail?
It is possible that a PeCOD will fail its calibration. If this occurs, the PeCOD will notify you of the reason it did not pass. Common reasons are that the M value or C value are out of range. Please refer to page 19 of the PeCOD Pro Operation manual for more information.
- How does the PeCOD method compare to BOD, TOC, and conventional COD?
There are several common methods to test wastewater and drinking water for organic pollutants, natural and chemical. Chemical Oxygen Demand (COD), Biochemical Oxygen Demand (BOD) and, Total Organic Carbon (TOC) compromise the three main methods of testing water samples. BOD and COD methods differ from TOC because they measure the amount of oxygen that is depleted by organic species in water. Moreover, TOC is a measure of all carbon (both organic and inorganic), rather than the oxygen that is reduced by these species. As written by a TOC manufacturer, “TOC on its own sheds no light on the oxidizability of the measured carbon or the amount of oxygen needed for its biodegradation.” Specific to COD, it measures the reactive fraction of the TOC. This is also known as oxidizability in the European Union.
View the full article: Comparison of COD, BOD and TOC Methods for organics, which summarizes the advantages and disadvantages of the COD, BOD and TOC methods, and compares them to the PeCOD method.
- How can I make Calibrant and Check Standard solutions?
View our instructions for producing 1L calibrants, check standards and for more information on these solutions: https://mantech-inc.com/wp-content/uploads/2020/09/1-L-calibrant-instruction.pdf
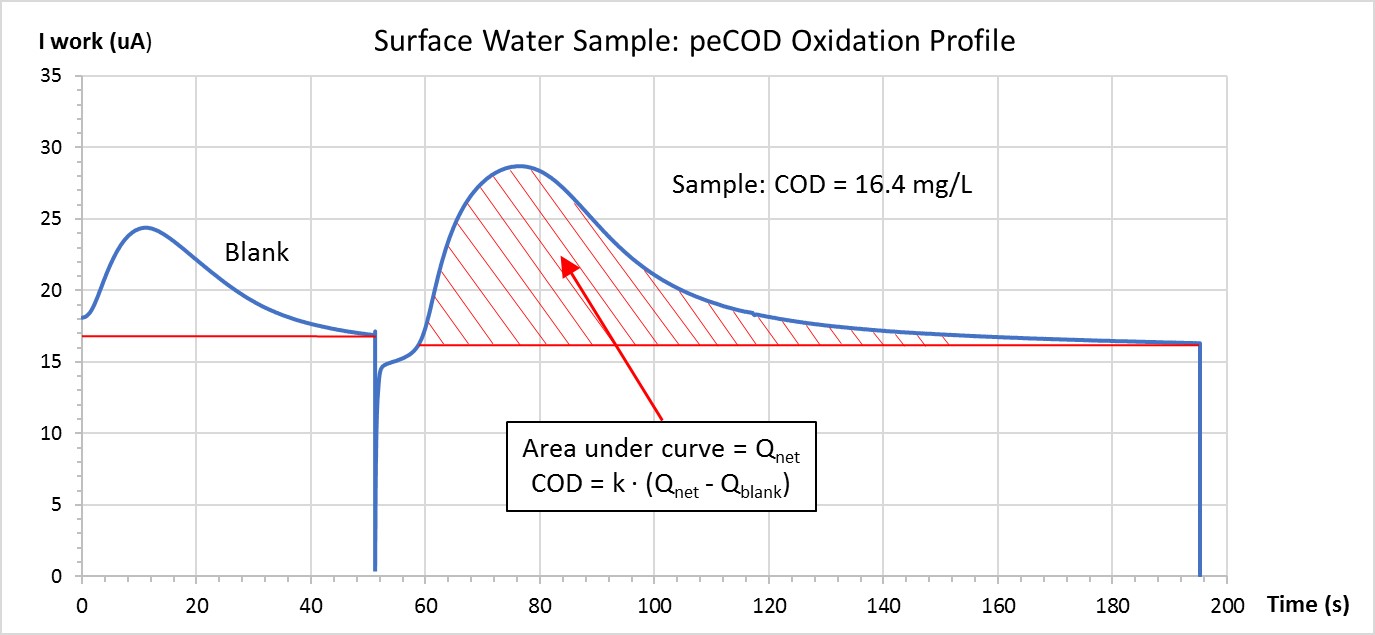
- How does the PeCOD Analyzer determine oxygen demand?
The PeCOD® Analyzer performs advanced oxidation on a small volume of sample. As the reaction proceeds, electrical charge is generated proportional to the oxygen being consumed. The PeCOD® analyzer captures this generated charge, plotting the output current from the reaction over time as shown below. The area under the curve generated by plotting current over time is proportional to the oxygen demand of the sample. A blank charge is also determined for each sample, and subtracted from the total charge to ensure accuracy.
View the detailed overview of peCOD technology and calculations here.

- I have an Error Code displayed on my PeCOD Analyzer, what does it mean?
For information about what the error code displayed on your PeCOD Analyzer represents, click here.
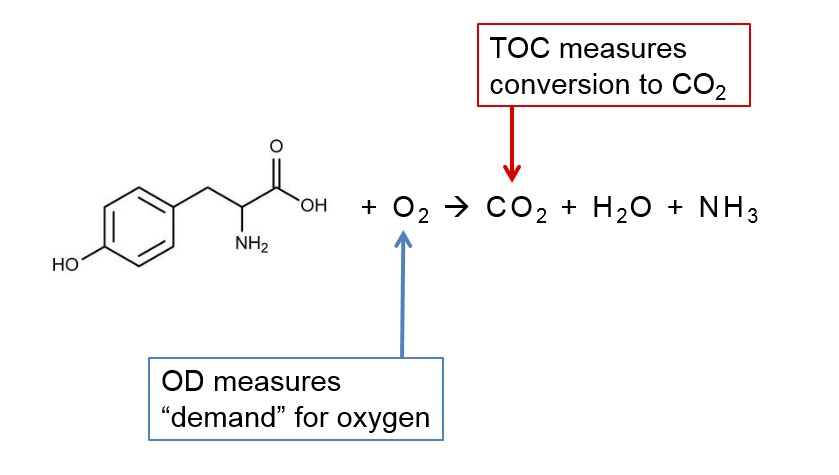
- What is oxygen demand?
OD (Oxygen Demand) measures the chemical reactivity of organics by the demand for oxygen, as shown in the diagram below. It can be used as an additional tool in the characterization of NOM (Natural Organic Matter) to predict DBP (Disinfection by-product) formation. This metric also allows for rapid feedback and optimization of coagulation and disinfection dose requirements.
- What is natural organic matter?
Natural organic matter (NOM) is a critical target for drinking water treatment because it causes a negative effect on water quality by color, taste and odor, and can react with disinfectants to form disinfection by-products (DBP). There are several tools for measuring NOM in source and ground water that include total organic carbon (TOC), dissolved organic carbon (DOC), UV absorbance at 254 nm (UV254), specific UV absorbance (SUVA), and chemical oxygen demand (COD).
- What is UV254?
UV254 is a water quality test which uses ultraviolet light of 254nm wavelength to measure natural organic matter in water and wastewater.
- What are THMs?
THMs (trihalomethanes) are disinfection by-products (DBP’s) formed when residual chlorine reacts with elevated levels of naturally occurring organic matter found in water. THMs are present in most drinking water supplies and are dependent on several factors such as type of organic material present and chlorine dosage.
- What is total organic carbon?
TOC (Total Organic Carbon) is the amount of carbon based organic contaminants in a water system. TOC does not identify each specific organic contaminant present, but rather an absolute quantity of all carbon-bearing molecules. In other words, TOC is a way to measure organic contaminants that may pose a threat to drinking water or wastewater systems.
- What is chemical oxygen demand?
Chemical Oxygen Demand (COD) analysis is a measurement of the oxygen-depletion capacity of a water sample contaminated with organic waste matter. Specifically, it measures the equivalent amount of oxygen required to chemically oxidize organic compounds in water. COD is used as a general indicator of water quality and is an integral part of all water quality management programs. Additionally, COD is often used to estimate BOD (Biochemical Oxygen Demand) as a strong correlation exists between COD and BOD, however COD is a much faster, more accurate test. Learn more here.
- Does PeCOD® require filter or homogenizer for samples with large particles?
For samples containing particles larger than 50μm, a pre-filtration or homogenization step is required. For biochemical oxygen demand (BOD) analysis, a simple pre-filtration step is required. For chemical oxygen demand (COD) analysis, no filtering required as we recommend a homogenizer that gets all particles to a 1micron size. We use the below:
PRO200 Homogenizer with SS Probe – This is our base model and setup can be used within 5ml-50ml tubes with sample piece size of 10mm or less or liquid base sample up to 100ml. (MANTECH part number: PCH-4000-197)
PRO250 Homogenizer with SS Probe – When there is a more viscous/thick or larger solid sample piece over 10mm, our 20mm X 115mm SS Probe would be needed. This homogenizer & probe setup can cover 50ml-500ml tubes/beakers. Other probes can be used with this Homogenizer for even larger volumes. (MANTECH part number: PCH-4000-198)
Homogenization can be automated using the autosampler arm and in our online analyzer.
- What is the acceptance range for MANTECH's pre-mixed secondary standards?
The acceptable range for MANTECH’s pre-mixed secondary standards is ±20%.
- What is MANTECH's recommended passing criteria for the M value, C value, and I term when calibrating?
MANTECH’s recommended passing criteria varies for each colour range. The image below outlines the recommended criteria for each range.

- What is a QC Check in the PeCOD calibration?
When calibrating the PeCOD, the final step of the QC regime is to complete a QC Check on the pre-mixed calibrant solution. This will analyze the COD value of the pre-mixed calibrant solution to confirm the accuracy of the calibration.
- How do I edit PeCOD Parameters in MANTECH Pro?
For a video tutorial on changing PeCOD Parameters in MANTECH Pro, click here.
- How do I edit the passing criteria for a QC Regime in MANTECH Pro?
For a video tutorial on changing the passing criteria for a QC regime in MANTECH Pro, click here.
- What items are required for each PeCOD configuration (benchtop, automated, or online)?
Based on the PeCOD model (benchtop, automated, or online), each system configuration will differ. To view the items required for each model, click here.
- What are the specifications of the external battery pack for the L50?
Type of Battery: Rechargeable NiMH battery
Battery Voltage: 12V
Battery Capacity: 3.8 Ah
Battery Life: Entire day of typical PeCOD use
Charging Time: Approximately 9.5 hours
For more information about the L50 battery packs, please see the manual here.
- How much do the PeCOD solutions weigh?
Solution Type Weight (g) 1L Electrolyte (Adv. Blue Range) 1400 g 500mL Electrolyte (Green, Yellow and Red Ranges) 647 g 250mL Calibrant (All Ranges) 312 g 250mL Blank (All Ranges) 314 g 250mL Check Standard (All Ranges) 311 g - How do I change the C value settings in MANTECH Pro and PeCOD Pro?
MANTECH now has a new PeCOD Sensor recipe that allows for more sample sensitivity. With this change, a parameter will need to be updated for use. The C value on the calibration and new sensor settings will no longer need to have an upper limit as the more sensitive burn on the sensor increases the C value. Click here to view a PDF on how to change your C value settings in PeCOD Pro and Mantech Pro.
- What information is required for PeCOD analysis?
PeCOD can greatly increase the efficiency and transparency of chemical oxygen demand (COD) or estimated biochemical oxygen demand (BOD) results of a laboratory, factory, wastewater treatment plant and more. To perform this analysis, the following information is required:
- What is the COD or BOD concentration range to measure?
- How many samples will be analyzed per day or per week? Whichever applies.
- Why do you measure COD currently? For example, production control, effluent compliance, etc.
- Do you do on-site treatment? If so, What is the treatment train?

‘Optimized’ TOC Analyzer (Total Organic Carbon)
MANTECH’s revolutionary PeCOD® Analyzer technology measures the chemical reactivity and associated oxidative changes in Natural Organic Matter (NOM). As a result it is more sensitive than Total Organic Carbon (TOC) and UV254 to changing NOM concentrations in source and treated drinking waters. For this reason, the PeCOD® can be implemented as an “Optimized” TOC Analyzer, providing a critical indication of the oxidizability of the organic carbon in a water sample.
Introduction to the PeCOD® L50 ‘Optimized’ TOC Analyzer.
Download PeCOD® L50 Technical and General Specifications.
Download the brochure for Drinking Water application and Online Analyzer.
Follows ASTM International approved method D8084
Benefits
PeCOD is the fastest available method for quantifying oxygen demand (OD), providing operators with real time data needed to make timely, impactful decisions that enhance environmental protection while generating substantial savings on chemical and energy use. It offers a low detection limit (< 1 mg/L) with results generated in less than 10 minutes.
PeCOD offers a safe, fast and green chemistry method that can be used by anyone. This eliminates the need for trained analytical chemists on staff or an external lab facility
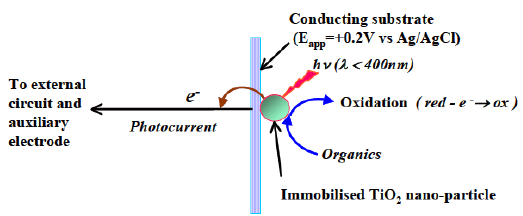
The core of the technology is the PeCOD sensor, which consists of a UV-activated nanoparticle TiO2 (titanium dioxide) photocatalyst coupled to an external circuit. When a sample is introduced into the microcell containing the PeCOD sensor, the TiO2 is irradiated by UV light, and a potential bias is applied. The UV light creates a photohole in the TiO2 sensor with a very high oxidizing power and organics in the cell are oxidized. PeCOD is extremely accurate across a broad range of organics. The powerful oxidizing potential of UV-illuminated TiO2 ensures that virtually all species will be fully oxidized giving a true measure of OD.
The PeCOD® Analyzer is available in a variety of configurations that use the same innovative technology and method. PeCOD combines robust performance and flexibility to suit the needs of your laboratory or process operations.
PeCOD is placed directly in the hands of operators for quick meaningful impacts.
Walk up and analyze when you want. No complex ovens, gas, syringes, etc.
70% lower cost than conventional TOC analyzers!
Applications
-
Drinking Water
-
Research and Laboratory
-
Source Water
-
Water Reuse
Video Gallery
Models and Specifications
MANTECH is excited to announce that the release of the PeCOD® L50 Model! See here for more details.
The L50 is a direct replacement for the L100 shown in previous videos and pictures. The L50 offers a simpler, industrial and robust design, with improved pricing over the L100. Contact us for more information.
The PeCOD® Analyzer is available in laboratory, portable and online configurations that are highly customizable. The PeCOD® system can be configured to accommodate laboratory operations, automated sampling, or continuous process monitoring.
The Benchtop L50 PeCOD® Analyzer is MANTECH’s base model for use in municipal, government and academic lab settings.
System Benefits:
- Small footprint (280 x 210 mm, 11.00 x 8.25 in)
- Lightweight (7 kg, 15.5 lb)
- MANTECH’s MANTECH Pro™ software adds automation and a sleek user interface
- Can be upgraded to Automated or Online systems
* Discontinued L100 model displayed
The world’s fastest method for oxygen demand (OD) analysis is also available in a portable field unit. Just add the battery and carrying case and OD can be measured in the field!
System Benefits:
- Small footprint (508 x 355.6 x 609.6 mm, 20 x 14 x 24 in)
- Convenient case with wheels (weighs approximately 16 kg, 35 lb with analyzer & supplies)
- No sample digestion is required, making it a truly portable technique
- MANTECH’s MANTECH Pro™ software adds automation and a sleek user interface
The Automated L50 PeCOD® Analyzer provides unattended analysis for a large number of samples.
System Benefits:
- Unattended, continuous analysis of 100s of samples
- System is pre-calibrated before the start of each work day
- Additional parameters can be added on, including pH, EC, alkalinity, BOD and turbidity
![]()
The Online L50 PeCOD® Analyzer will automatically grab samples from a low flow line or water tank, at scheduled time intervals.
System Benefits:
- Save time and money through process optimization with real time OD results
- Option to add automated pH adjustment and dilutions
- Additional parameters can be added on, including pH, conductivity, alkalinity, and ammonia
- Human Machine Interface (HMI) touchscreen allows operators control of the analyzer
All of our systems can be customized to suit your needs. Contact us for more information.
Case Studies and Resources
Frequently Asked Questions
PeCOD FAQ

OD (Oxygen Demand) measures the chemical reactivity of organics by the demand for oxygen, as shown in the diagram below. It can be used as an additional tool in the characterization of NOM (Natural Organic Matter) to predict DBP (Disinfection by-product) formation. This metric also allows for rapid feedback and optimization of coagulation and disinfection dose requirements.
The PeCOD® Analyzer performs advanced oxidation on a small volume of sample. As the reaction proceeds, electrical charge is generated proportional to the oxygen being consumed. The PeCOD® analyzer captures this generated charge, plotting the output current from the reaction over time as shown below. The area under the curve generated by plotting current over time is proportional to the oxygen demand of the sample. A blank charge is also determined for each sample, and subtracted from the total charge to ensure accuracy.
View the detailed overview of peCOD technology and calculations here.
Natural organic matter (NOM) is a critical target for drinking water treatment because it causes a negative effect on water quality by color, taste and odor, and can react with disinfectants to form disinfection by-products (DBP). There are several tools for measuring NOM in source and ground water that include total organic carbon (TOC), dissolved organic carbon (DOC), UV absorbance at 254 nm (UV254), specific UV absorbance (SUVA), and chemical oxygen demand (COD).
UV254 is a water quality test which uses ultraviolet light of 254nm wavelength to measure natural organic matter in water and wastewater.
THMs (trihalomethanes) are disinfection by-products (DBP’s) formed when residual chlorine reacts with elevated levels of naturally occurring organic matter found in water. THMs are present in most drinking water supplies and are dependent on several factors such as type of organic material present and chlorine dosage.
TOC (Total Organic Carbon) is the amount of carbon based organic contaminants in a water system. TOC does not identify each specific organic contaminant present, but rather an absolute quantity of all carbon-bearing molecules. In other words, TOC is a way to measure organic contaminants that may pose a threat to drinking water or wastewater systems.
The primary driver of the peCOD method chemistry is advanced oxidation induced by photocatalysis with Titanium Dioxide (TiO2). Pure TiO2 is only photoactive at wavelengths below 380 nm. This is because a certain amount of light energy is required to bump the electrons around and cause the behaviours that we associate with photocatalysis. The UV LED in the PeCOD® COD Analyzer operates at a peak wavelength of 365 nm, with a minimum 360 nm and maximum 370 nm, ensuring that efficient photocatalysis is achieved.
A common benefit of peCOD implementation for this application is optimization of coagulant dosing.
The traditional method up to this point has been consistent dosing based on laboratory testing results (jar testing is a very common method of developing coagulant dosing requirements). They then increase their dosing for events that they know to cause NOM spikes. The problem is they often don’t know the extent of the NOM spikes, so they increase their dosing to what has been deemed as ‘enough’. More often than not this is over-dosing, not really causing downstream issues but incurring more cost than is needed for these events. However, when the extra dose is not enough and they under-dose, NOM gets through and reacts with the disinfection chemicals creating DBPs.
The missing ingredient is knowing when these NOM spikes occur, and to what extent. The events could be anything from seasonal variation based on climate to rapid spikes from storm events, but the benefit of knowing is the same. Plants that have enough funding to do so monitor UV and TOC online, however research has shown that this is not enough. peCOD is another piece of the NOM puzzle and is truly the more important measure when looking at how NOM will react and be affected by treatment. If you know the COD of the NOM coming in and can match it to known dosing requirements, you minimize the possibility of DBPs forming.
The speed and ease of use of the peCOD is also key here, you are placing this knowledge directly in the operators’ hands, rather than having it be a result they wait to get back from an external lab. When they can truly understand the technology and it’s value, it has a secondary effect of getting them more involved with optimizing the treatment processes. We see with numerous cases (mostly in WWTPs at this point) this occurring, where they get the peCOD for measuring one or two points then realizing the benefit it can have through monitoring their whole plant.
pH Range: 4.0 – 10.0 (after mixing with electrolyte)
The peCOD method requires that the pH of a sample AFTER being mixed with electrolyte must be between 4 – 10. To determine if a sample must be pH-adjusted, mix the sample with peCOD electrolyte at the proper mixing ratio for your COD range, then test the pH of the mixture.
For example, the sample may have a pH of 3.0, but then after preparing with electrolyte, the pH is in the required range, therefore, it is acceptable for immediate peCOD measurement.
If samples have been preserved in acid, they should be neutralized using sodium hydroxide prior to analysis to avoid a low reading, as well as damage to the sensor. When the sample pH is below 4, the photocatalytic oxidation at the TiO2 sensor is affected, leading to poor reproducibility and charge values below theoretical expectation. Below a pH of 2, the TiO2 displays instability. When the pH is above 10, the charge measured for the reference and sample solution yield lower than expected values, again caused by interference at the TiO2 sensor. Sulphuric acid should be used to lower the pH of samples with a pH of 10 or more.
Samples must be filtered prior to peCOD analysis to ensure that no particulates greater than 50 micron (um) are primed into the peCOD. Particulates larger than 50um can cause clogging, which can lead to damage of the internal fluidics of the machine. To prevent clogging and ensure proper sample preparation, MANTECH has a Sample Filtering Guide for PeCOD Analysis.
For pulp and paper and wastewater applications, MANTECH recommends using a 35um polyethylene (PE) syringe filter. These filters can contribute trace amounts of organics, which are negligible for wastewater applications. For drinking and source water applications it’s important to use a filter that does not contribute organics to the filtered sample. One of MANTECH’s research partners has recommended a 0.45um polyethersulfone (PES) filter; however, other filter types may also be acceptable, if no organics are contributed by the filter. Since these applications traditionally see less particulates, having a smaller pore size filter hasn’t shown an impact on the peCOD results.
There is a strong correlation between the peCOD COD results and the dichromate COD results. To determine this, the two methods were compared vs. the theoretical oxygen demand (ThOD) for 34 organic species. See MANTECH’s technical bulletin for more information on the study.
What are the reasons for differences between the peCOD COD and Dichromate COD results in some cases?
Chemical Oxygen Demand (COD) results may differ when measured via the peCOD COD method versus the traditional dichromate COD method for certain sample matrices. There are various reasons for this difference. One is that chloride, ammonia, and some heavy metals have been known to interfere with peCOD readings and provide inaccurate results. Another reason could be the time delays between analyses. It is best to analyze samples via peCOD and dichromate on the same day to limit uncertainties due to sample degradation. For additional reasons and more information, read MANTECH’s technical bulletin here.
The peCOD electrolyte solution is mainly composed of a low-concentration lithium nitrate solutions. The peCOD calibrant and check standard solutions supplied by MANTECH are composed of sorbitol. These solutions contain a trade recipe preservative that allow for the longer shelf life, compared to solutions prepared manually. Calibrant and check standard solutions prepared manually, following the peCOD Standard Recipe, can be used for up to two weeks.
View the peCOD electrolyte SDS here and EU compliant SDS here.
View the peCOD calibrant SDS here and EU compliant SDS here.
View the peCOD check standard SDS here and EU compliant SDS here.
View the peCOD pre-mixed blank SDS here and EU compliant SDS here.
View the peCOD pre-mixed calibrant SDS here and EU compliant SDS here.
Both MANTECH supplied calibrant and standard solutions are good for one year after they are made. MANTECH supplied electrolyte has a shelf life of two years after it is produced. All labels have the expiry date in the box just above the MANTECH logo.
Sensors are expected to last 150 runs when used consistently for an average of 50 samples per week (samples, calibrations and QC checks). However, should a sensor be intermittently used, it is recommended that it be changed after 3-4 weeks of use regardless of the number of completed runs, or based on consistently failing calibration values. When analyzing higher sample concentrations (especially red range) the sensor life expectancy is likely to be shorter, ranging from 60 – 150 total measurements. For more information, read MANTECH’s technical bulletin here.
Open the top plastic door by pushing down firmly on the front centre of the door until a “click” is heard, then release the door. Open the PeCOD® Analyzer module by pressing firmly down on the fixed bar, and lifting the front latching bar (should unlatch), then lift up the peCOD sensor lid. Remove the old sensor by lifting it off of the pins and place the new sensor on the same pins with the “THIS SIDE UP” surface (blue side) facing you.
If only storing the electrode block for a short period of time (less than 4 weeks), rinse DI water through the PeCOD and leave the electrode block inside. Make sure all of the sample has been washed through by priming Port A several times. If storing for more than 4 weeks, put DI water through the PeCOD and then remove the electrode block to store outside the PeCOD. Flush the channels with 20-30 mL of DI water before pushing through about 10 mL of NaCl, leaving the channels filled. Tape the ends of the channels to ensure no leaks or crystallization occur. For more information, read the storage instructions here.
There are limitations to ensure that, after dilution with electrolyte, the chloride concentration will be <200mg/L. This means that the allowable chloride concentration of the original sample varies depending on the COD range (as illustrated below) since each range has a different ratio of sample to electrolyte. For more information, read MANTECH’s technical bulletin here.
The following tables summarize the impact of a range of common inorganic anions and cations on the determination of COD using the PeCOD® technique. You can download this FAQ as a pdf document at this link.
For each inorganic species, solutions containing 0, 20, 50, 100, 250, 500 ppm (by mass) of the anion or cation, 60ppm COD (as sorbitol) and 1M LiNO3 (containing 20ppm COD spike) were prepared and analyzed, unless otherwise stated. Therefore, the below ion concentrations represent the concentration IN THE CELL (i.e. if analyzed in a different range, the interference levels may vary due to different electrolyte dilution effects).
| Anions | Formula | Remark |
| Ammonium | NH4+ | No interference for NH4+ ≤ 500 ppm
Note: Similar results are obtained for Ammonia |
| Carbonate | CO32- | No interference for CO32- ≤ 500ppm using chloride resistant sensor |
| Chlorate | ClO3– | No interference for ClO3– ≤ 500ppm |
| Chloride | Cl– | No interference for Cl– < 200 ppm. COD reduced by up to 20% at Cl- levels of 500ppm using Chloride resistant sensor. Other halides (F-, Br-, I-) would be expected to behave in the same manner |
| Nitrate | NO3– | No interference, NO3– can be used as PeCOD electrolyte |
| Nitrite | NO2– | No interference for NO2– ≤ 500ppm |
| Perchlorate | ClO4– | No interference, ClO4– can be used as PeCOD electrolyte |
| Phosphate | PO43- | No interference for PO43- ≤ 500ppm |
| Sulfate | SO42- | No interference for SO42- ≤ 500ppm |
| Sulfite | SO32- | Interference for SO3 ≥ 20 ppm, giving COD high by 90% at 250 ppm SO32- |
| Sulfide | S2- | Interference for S2- > 0 ppm, giving COD high by >100% at 50 ppm S2- |
| Cations | Formula | Remark |
| Aluminum | Al3+ | No interference for Al3+ ≤ 500ppm |
| Calcium | Ca2+ | No interference for Ca2+ ≤ 500ppm |
| Chromate | Cr3+ | Interference for Cr3+ > 2 ppm, giving low COD |
| Ferric Iron | Fe3+ | No interference for Fe3+ ≤ 500ppm |
| Ferrous Iron | Fe2+ | Interference for Fe2+ > 100 ppm, giving low COD |
| Magnesium | Mg2+ | No interference for Mg2+ ≤ 500ppm |
| Potassium | K+ | No interference for K+ ≤ 500ppm |
| Silver | Ag+ | Interference for Ag+ > 10 ppm, giving low COD |
| Sodium | Na+ | No interference for Na+ ≤ 500ppm |
| Zinc | Zn2+ | No interference for Zn2+ ≤ 500ppm |
There are 4 COD ranges for the PeCOD® Analyzer. The advanced blue range is the lowest range and analyzes samples up to 25mg/L with a mixing ratio of 3:1 (sample to electrolyte). Green is the second lowest range and measures up to 150mg/L with a mixing ratio of 1:1. The yellow range determines COD up to 1,500mg/L with a mixing ratio of 1:9 and the red range can analyze samples up to 15,000mg/L and has a mixing ratio of 1:49. For more information, read MANTECH’s technical bulletin here.
A C value is reported after a calibration. It is measured in μC, and indicates the raw charge generated during the blank oxidation. In PeCOD Pro, the C Value can also be referred to as the Zero Charge (Z1). The expected C value ranges depend on the color range you are working in (advanced blue and green ranges have lower C values than yellow and red ranges). The acceptable values are 50-300 µC for advanced blue range, 150-700 µC for green, 200-750 µC for yellow range, and 250-800 µC for the red range.
An M Value is also reported at the end of a calibration. It is a ratio of the expected COD to the charge generated during the reference oxidation (of the calibrant solution). It is expressed as COD/μC. The acceptable M value range for the green, yellow, and red ranges is 0.02-0.06 COD/μC. The advanced blue range has an acceptable M value range of 0.01-0.08 COD/μC.
The Y-axis of the oxidation graph is defined as the Iwork (reported as μA) which is a measure of current. The Iterm is essentially the Iwork at the end of each oxidation curve as it levels off. The acceptable Iterm value for advanced blue and green ranges is >16 μA. For the yellow and red ranges, the Iterm value needs to be >14 μA.
The PeCOD® Analyzer conforms to regulatory standards such as the ASTM International Method D8084, the Ministry of Environment, Conservation and Parks, Ontario (MECP) method E3515, and the Health Canada Guidance on drinking water.
The ASTM International method for photoelectrochemical oxygen demand is approved for measuring organics in freshwater sources and treated drinking water. More details about this method can be viewed here.
The Ontario MECP method E3515 replaced the standard dichromate methods due to the fact that no harmful chemicals are used in the PeCOD method. This method now includes PeCOD as an approved alternate COD method in the Municipal and Industrial Strategy for Abatement (MISA). The MECP method can be viewed here.
The peCOD method is also referenced in the Health Canada Guidance on Natural Organic Matter in Drinking Water. COD has been added as a parameter with a <5ppm limit, only the peCOD method is referenced for the parameter, and peCOD is also referenced as a “parameter” to monitor in source waters for drinking water plants. For more information, read the article in Environmental Technology here.
The PeCOD® Analyzer has a warning label on the analyzer head “DO NOT OPEN ANALYZER LID WHILE IN OPERATION” and “CAUTION: CLASS 3B INVISIBLE LASER RADIATION. AVOID EXPOSURE TO BEAM.” See Image 1.
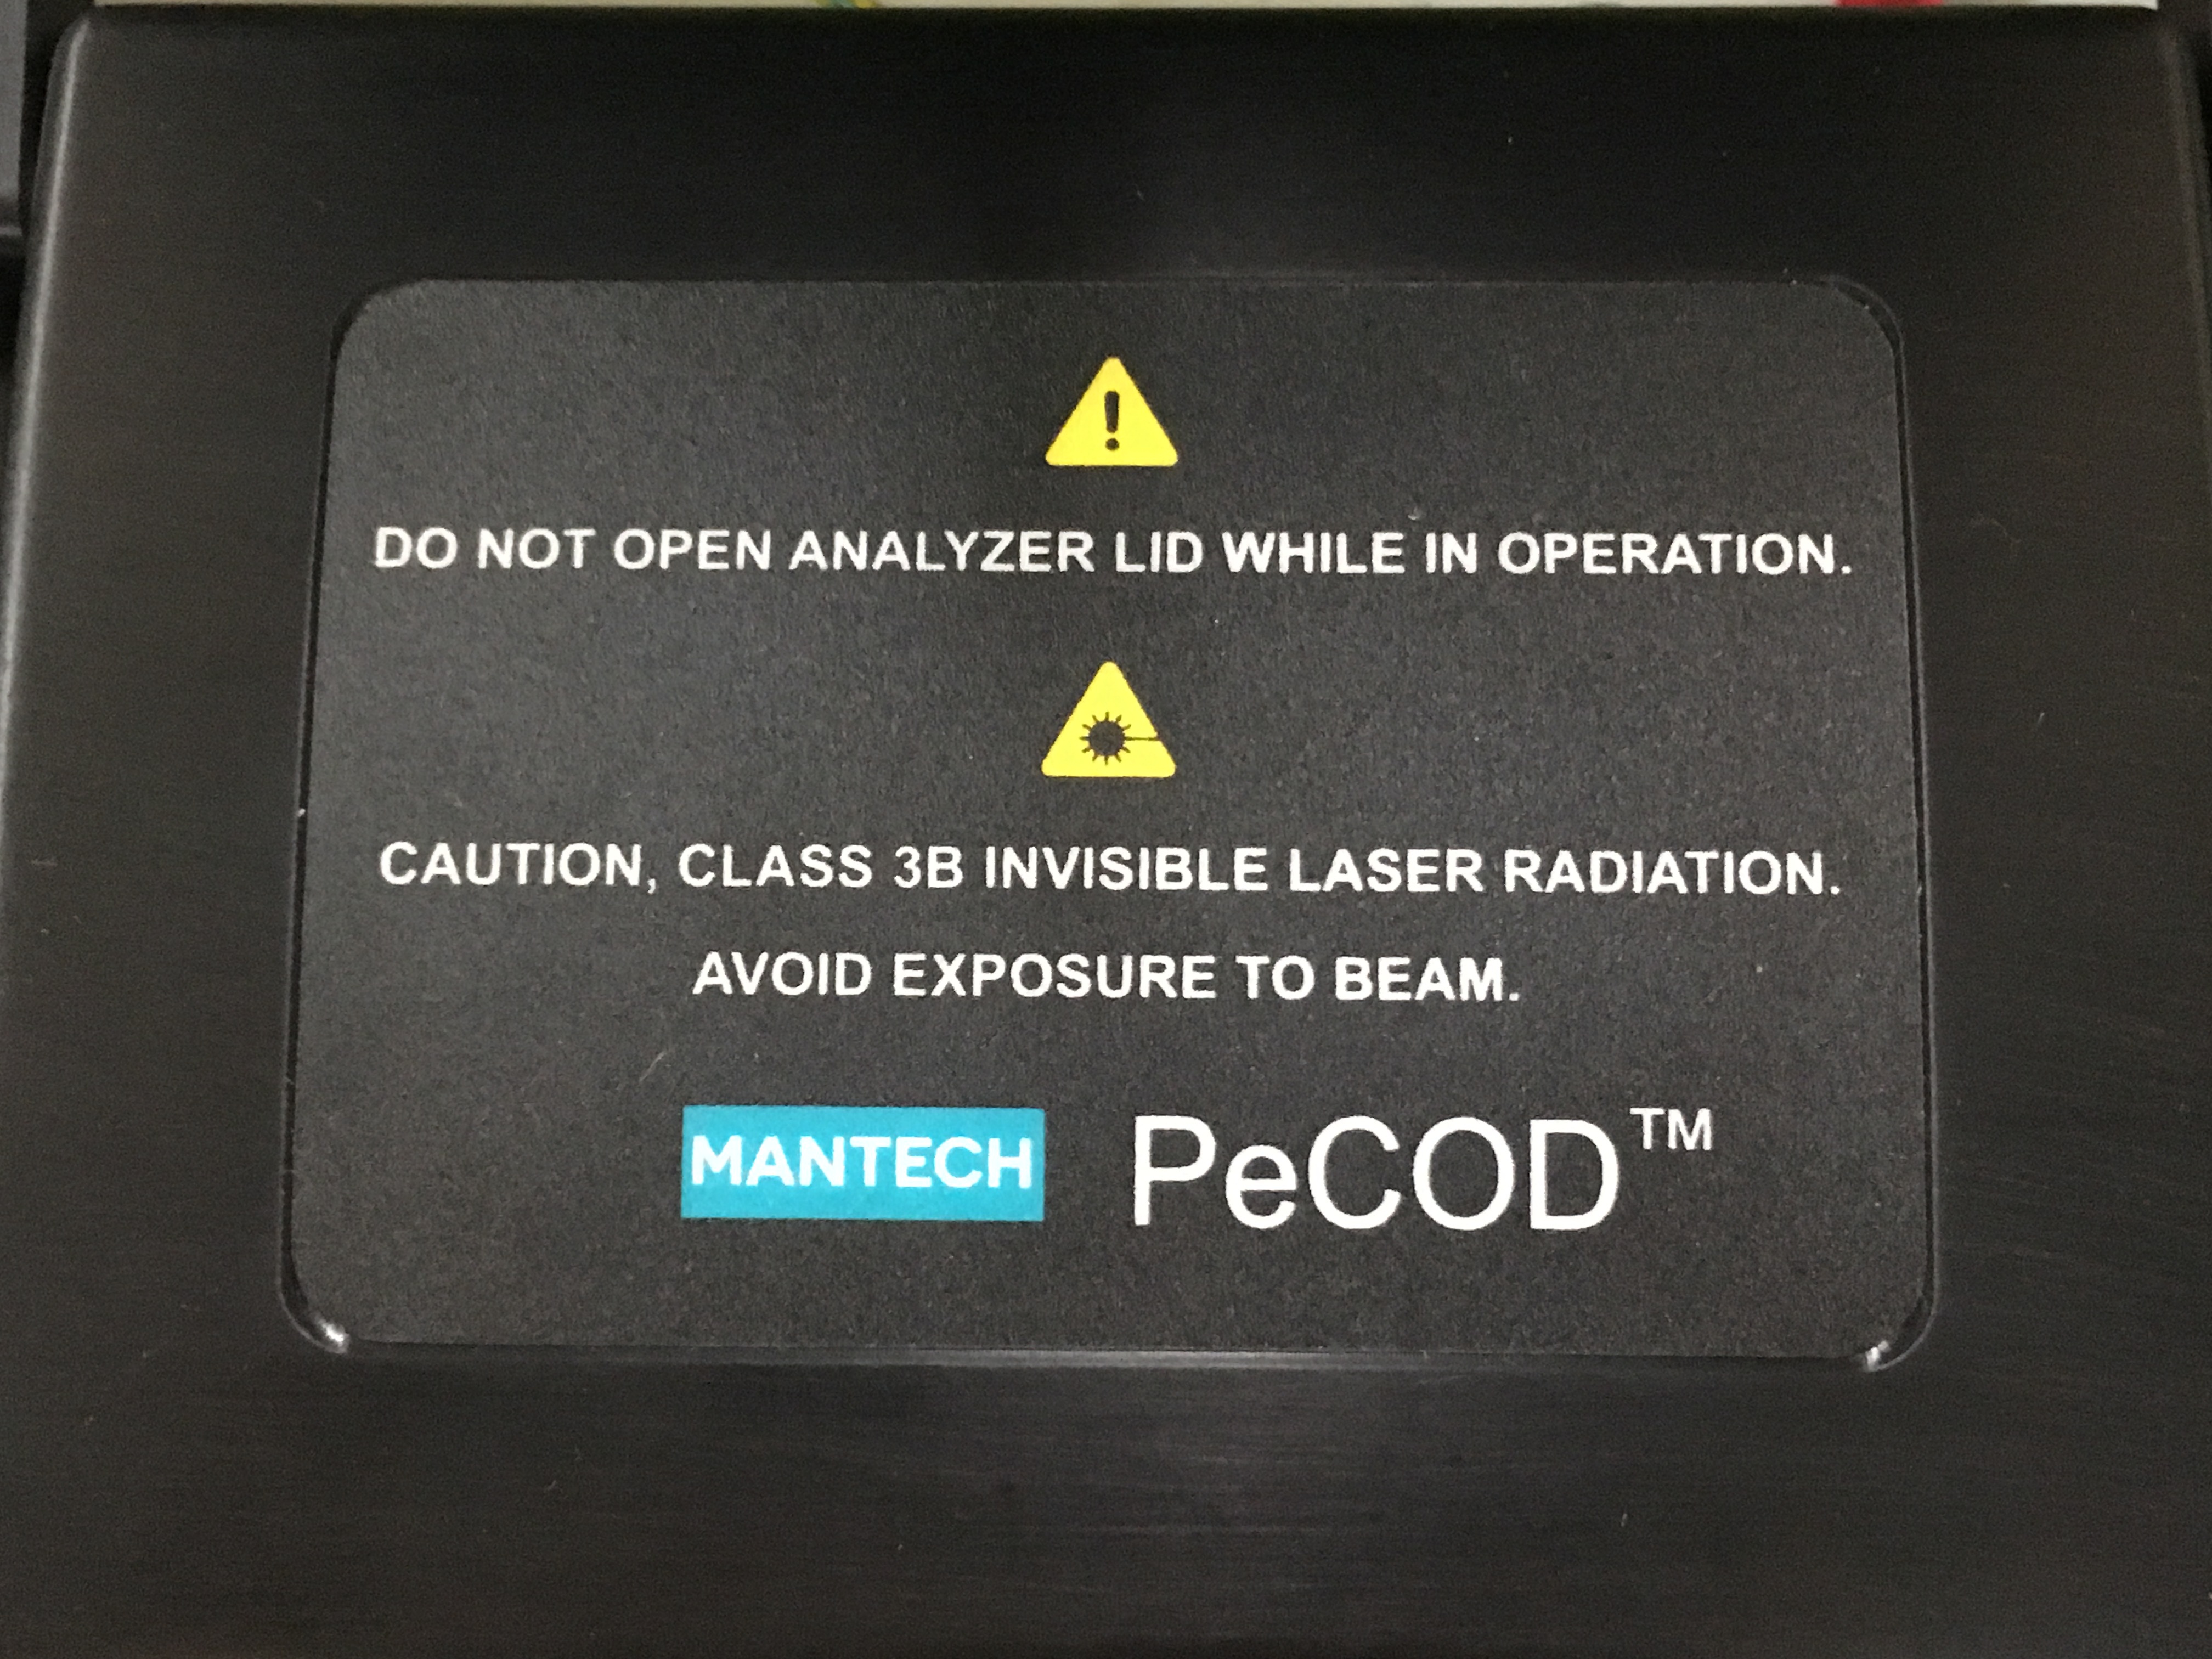
Image 1: Warning label on analyzer lid
There are two normal LED lights (one red, one green), and one (invisible) Class 3B UV LED laser. See Image 2.
The red LED light is an error indicator and is a non-harmful light. The green LED light is the power indicator and is also a non-harmful light.
The Class 3B UV LED laser is a catalyst for TiO2 oxidation of organics. Class 3B UV LED lasers are harmful to your health, however, there are safety measures put into place to avoid exposure to this invisible UV LED laser on the PeCOD® Analyzer. The PeCOD® Analyzer has an automatic laser shut off built in so the laser will turn off when the analyzer lid is opened. This lid should not be tampered with or modified as the Class 3B laser is hazardous to your health.
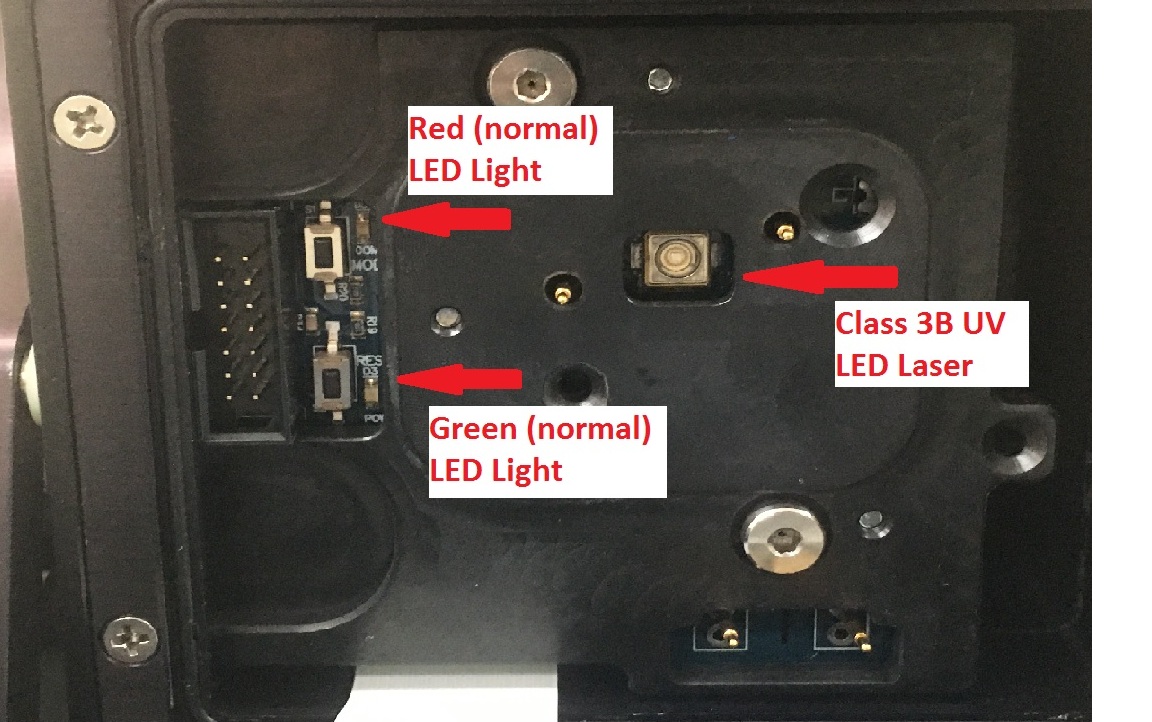
Image 2: Analyzer head with 2 (two) normal LED lights, and 1 (one) 3B UV LED Laser
The L50 is the newer, more cost efficient model of the PeCOD® Analyzer. It uses the same method, reagents, and software as the L100. Improvements were made with the fluidics and space requirement in the L50 model. For more information, see the news section.
Click ‘File’ in the top left corner, and select ‘Preferences’. The ‘General’ tab will pop up, select the ‘QC Regimes’ tab. Here you can see how many calibrations, QC checks, and recalibrations the PeCOD® will preform for the ‘Startup (Daily) Regime’. To see the other regimes, select the ‘Startup (New Sensor)’ tab, or the ‘QC Routine’ tab in the second row. To edit the number of calibrations or QC checks, click the arrows beside the numbers to choose how many of each the PeCOD® will perform.
MANTECH recommends storing samples in the laboratory fridge vs preserving samples. If you do choose to preserve your samples, use H2SO4 to adjust the pH of your samples to ~2.
For calibration, the PeCOD® Analyzer goes through the following phases:
- Normalization Phase. This is where the PeCOD® Analyzer is adjusting the LED lamp output, trying to achieve a baseline of 20µA.
- Burn-In Phase (port B). This is where the pre-mix blank solution is brought into the sensor cell. It is oxidized to remove contaminants from the cell.
- Pre-Burn Phase (port B). This is where a new aliquot of pre-mix blank solution is brought into the sensor cell. This phase removed more contaminants from the cell and conditions the cell for the pre-mix blank.
- Oxidation (port B). A new aliquot of pre-mix blank is brought into the sensor cell and is oxidized. This value is used in the peCOD calculation. The area under this curve is used to calculate the ‘blank charge’, which corresponds to the C value determined by each calibration. This is the small amount of COD contributed by the electrolyte reagent, which is then subtracted from all future COD analyses to give the final COD result.
- Pre-Burn (port A). A new aliquot of pre-mix calibrant solution is brought into the sensor cell where it is oxidized. This removes contaminants from the cell and conditions the cell for the pre-mix calibrant.
- Oxidation phase (port A). A new aliquot of pre-mix calibrant if brought into the sensor cell. This value is used in the peCOD calculation. The area under the curve is used to calculate the reference charge, which is used with the blank charge to determine the relationship between charge and COD. This corresponds to the M value determined by each calibration.
For sample analysis, the PeCOD® Analyzer goes through the following phases:
- Burn-In phase (port B). The pre-mix blank solution is brought into the sensor cell and is oxidized. This removed contaminants from the cell.
- Pre-Burn phase (port A). An aliquot of sample is brought into the sensor cell and is oxidized. This removes contaminants from the cell and conditions the cell for the sample.
- Oxidation phase (port A). A new aliquot of sample is brought into the sensor cell and is oxidized. This value is used in the peCOD calculation. The area under the curve is used to calculate the charge generated by sample oxidation. The blank value will be subtracted from the sample value to determine the sample COD.
The typical benchtop L50 set up requires 36 inches x 18 inches of bench space, as shown in the figure below.
It is possible that a PeCOD® Analyzer will fail it’s calibration. If this occurs, the PeCOD® Analyzer will notify you of the reason it did not pass. Common reasons are that the M value or C value are out of range. Please refer to page 19 of the PeCOD Pro™ Operation manual for more information.
There are several common methods to test wastewater and drinking water for organic pollutants, natural and chemical. Chemical Oxygen Demand (COD), Biochemical Oxygen Demand (BOD) and, Total Organic Carbon (TOC) compromise the three main methods of testing water samples. BOD and COD methods differ from TOC because they measure the amount of oxygen that is depleted by organic species in water. Moreover, TOC is a measure of all carbon (both organic and inorganic), rather than the oxygen that is reduced by these species. As written by a TOC manufacturer, “TOC on its own sheds no light on the oxidizability of the measured carbon or the amount of oxygen needed for its biodegradation.” Specific to COD, it measures the reactive fraction of the TOC. This is also known as oxidizability in the European Union.
View the full article: Comparison of COD, BOD and TOC Methods for organics that summarizes the advantages and disadvantages of the COD, BOD and TOC methods, and compares them to the peCOD method.
An investment in the safe, green, and fast PeCOD® Analyzer and method includes the L50 PeCOD® Analyzer, starter kits, and consumables. This is typically packed in two boxes with the following weights and dimensions:
Box 1 (starter kits and consumables)
16” x 15” x 14”, 32lbs
41cm x 39cm x 36cm, 15kg
Box 2 (L50 PeCOD® Analyzer)
16” x 15” x 16”, 21lbs
41cm x 39cm x 41cm, 10kg
The L50 PeCOD® Analyzer is applicable for benchtop and portable use, with the incorporation of an external battery and carrying case. The L50 weighs less than 7kg and measures 280mm x 210mm x 260mm. Its rugged carrying case, equipped with wheels, makes it easy and safe to transport the unit between the field and the laboratory.
Person wheeling the portable peCOD carrying case.
If left sealed in the package, unopened PeCOD sensors have a shelf life of 12 months. Once opened and in use, sensors will last for approximately 1 month or 200 samples (whichever comes first). However, each sensor is different, so these guidelines may vary slightly across different sensors.
For information about what the error code shown on the PeCOD Analyzer represents, click here.
New PeCOD Analyzer orders typically include a reagent starter kit providing the consumables to run the PeCOD analysis. These kits consist of Electrolyte, Calibrant, and Secondary Standard reagents. Electrolyte is the reagent that is mixed with each sample, therefore it is typically the reagent to be used up first, requiring the user to purchase more from MANTECH. It is useful to know on average how many samples can be run with the electrolyte provided in the standard reagent starter kits, therefore we provide this information below.
You will need to know the color operating range of your PeCOD (Adv. Blue or Green). If you plan to run a single analysis per sample, use the left column for 10mL total volume. If you require duplicate or triplicate analysis per sample, use the right column for 20mL total volume. Depending on how many samples are run per calibration, these numbers may vary.
| 10mL Total Volume – Single Analysis | 20mL Total Volume – Duplicate and Triplicate Analysis |
|---|---|
For Advanced Blue range (3:1):
|
For Advanced Blue range (3:1):
|
For Green range (1:1):
|
For Green range (1:1):
|
Number of samples that can be run with 1L bottle of electrolyte:
|
Number of samples that can be run with 1L bottle of electrolyte:
|
Number of samples that can be run with 10L bottle of electrolyte:
|
Number of samples that can be run with 10L bottle of electrolyte:
|