- Why are my PeCOD values reading low in comparison to the dichromate method?
The most common cause is chloride interference.
Chloride interference can impact COD outputs no matter what methodology is used. For the PeCOD method, the interference is negative – the samples are measured as having lower COD values than expected (see the figure below for recommended limits). Meanwhile for the dichromate method, the interference is positive and results in higher COD values. This results in a significant discrepancy between the two different methods with neither measurement accurate when a chloride interference exists!
The solution for this challenge is as simple as diluting the problematic samples until the chloride concentration falls below the maximum allowance. The lowest range on the PeCOD has a maximum allowance of 400 mg/L while the dichromate method’s is 100mg/L according to Standard Method 5220. This can be increased to 1500 mg/L with supplementary mercury sulphate. Additionally, the detection limit of COD in the PeCOD is 0.7 mg/L in Advanced Blue and 1.0 mg/L in Green range. It is 50 mg/for the dichromate method when looking for quantitative results or 1.0 mg/L when estimated. This makes the PeCOD more suitable for both low-COD high-chloride samples as well as samples that need significant dilution due to high chloride levels.
In addition to the PeCOD method having higher chloride tolerance with lower detection limits, COD (and BOD) results are generated in 10 minutes utilizing a safe and green method.

- How does the PeCOD method compare to BOD, TOC, and conventional COD?
There are several common methods to test wastewater and drinking water for organic pollutants, natural and chemical. Chemical Oxygen Demand (COD), Biochemical Oxygen Demand (BOD) and, Total Organic Carbon (TOC) compromise the three main methods of testing water samples. BOD and COD methods differ from TOC because they measure the amount of oxygen that is depleted by organic species in water. Moreover, TOC is a measure of all carbon (both organic and inorganic), rather than the oxygen that is reduced by these species. As written by a TOC manufacturer, “TOC on its own sheds no light on the oxidizability of the measured carbon or the amount of oxygen needed for its biodegradation.” Specific to COD, it measures the reactive fraction of the TOC. This is also known as oxidizability in the European Union.
View the full article: Comparison of COD, BOD and TOC Methods for organics, which summarizes the advantages and disadvantages of the COD, BOD and TOC methods, and compares them to the PeCOD method.
- How many PeCOD samples can be analyzed with the reagent starter kit I received?
New PeCOD Analyzer orders typically include a slurry reagent starter kit providing the consumables to run the PeCOD analysis. These kits consist of Electrolyte, Calibrant, and Secondary Standard slurry reagents. Electrolyte is the reagent that is mixed with each sample, therefore it is typically the reagent to be used up first, requiring the user to purchase more from MANTECH. It is useful to know on average how many samples can be run with the electrolyte provided in the standard reagent starter kits, therefore we provide this information below.
You will need to know the color operating range of your PeCOD (Adv. Blue, Green, Yellow, or Red). If you plan to run a single analysis per sample, use the left column for 10mL total volume. If you require duplicate or triplicate analysis per sample, use the right column for 20mL total volume. Depending on how many samples are run per calibration, these numbers may vary.
10mL Total Volume – Single Analysis 20mL Total Volume – Duplicate and Triplicate Analysis For Advanced Blue range (3:1): - 7.5mL sample required
- 2.5mL electrolyte required
- 2L electrolyte provided in starter kit
- 800 samples can be run
For Advanced Blue range (3:1): - 15mL sample required
- 5mL electrolyte required
- 2L electrolyte provided in starter kit
- 400 samples can be run
For Green range (1:1): - 5mL sample required
- 5mL electrolyte required
- 2L electrolyte provided in starter kit
- 400 samples can be run
For Green range (1:1): - 10mL sample required
- 10mL electrolyte required
- 2L electrolyte provided in starter kit
- 200 samples can be run
For Yellow range (1:9): - 1mL sample required
- 9mL electrolyte required
- 2L provided in starter kit
- 222 samples can be run
For Yellow range (1:9): - 2mL sample required
- 18mL electrolyte required
- 2L provided in starter kit
- 111 samples can be run
For Red range (1:49): - 0.2mL sample required
- 9.8mL electrolyte required
- 2L provided in starter kit
- 204 samples can be run
For Red range (1:49): - 0.4mL sample required
- 19.6mL electrolyte required
- 2L provided in starter kit
- 102 samples can be run
Number of samples that can be run with 10L bottle of electrolyte: - Adv. Blue range, 4000 samples
- Green range, 2000 samples
- Yellow range, 1111 samples
- Red range, 1020 samples
Number of samples that can be run with 10L bottle of electrolyte: - Adv. Blue range, 2000 samples
- Green range, 1000 samples
- Yellow range, 555 samples
- Red range, 510 samples
Note: 5x Electrolyte slurry packages are required for making up 10L. - How does the PeCOD Analyzer calculate COD?
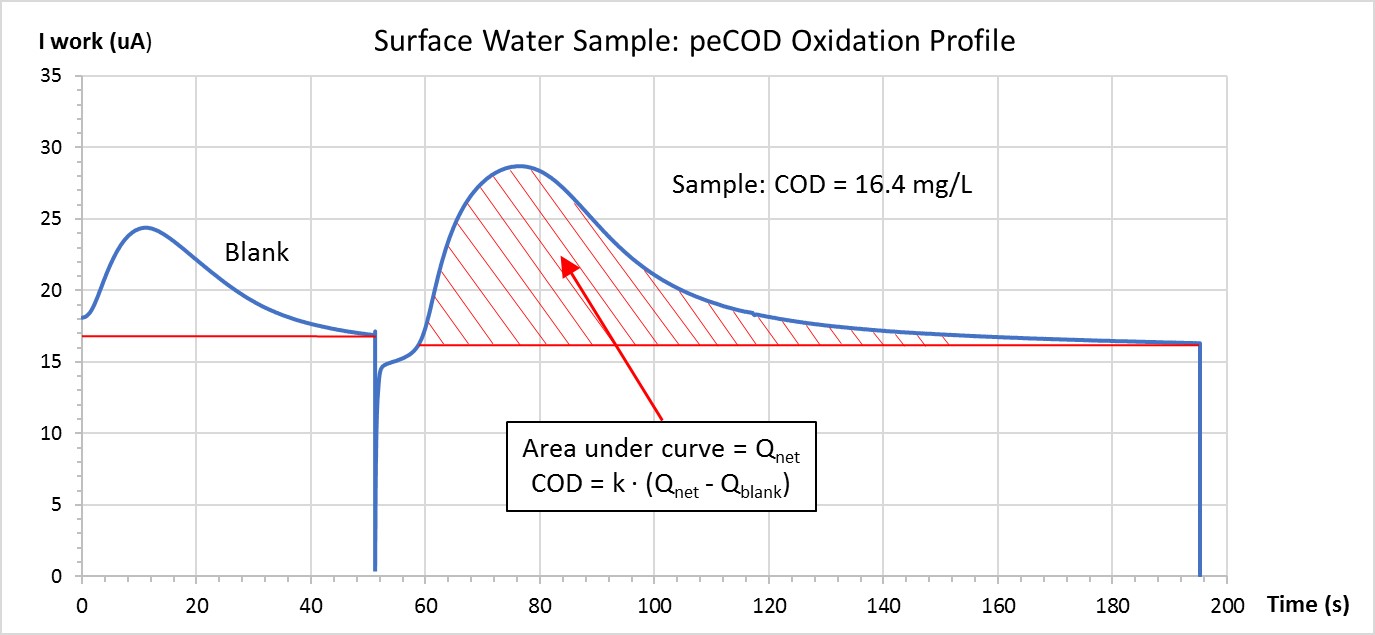
The PeCOD Analyzer performs advanced oxidation on a small volume of sample. As the reaction proceeds, electrical charge is generated proportional to the oxygen being consumed. The PeCOD analyzer captures this generated charge, plotting the output current from the reaction over time as shown below. The area under the curve generated by plotting current over time is proportional to the COD of the sample. A blank charge is also determined for each sample, and subtracted from the total charge to ensure accuracy.
View the detailed overview of PeCOD technology and calculations here.

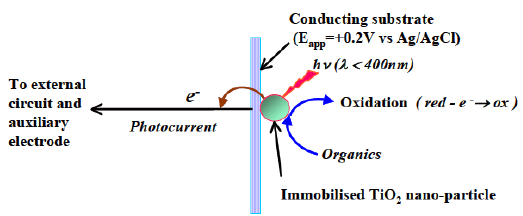
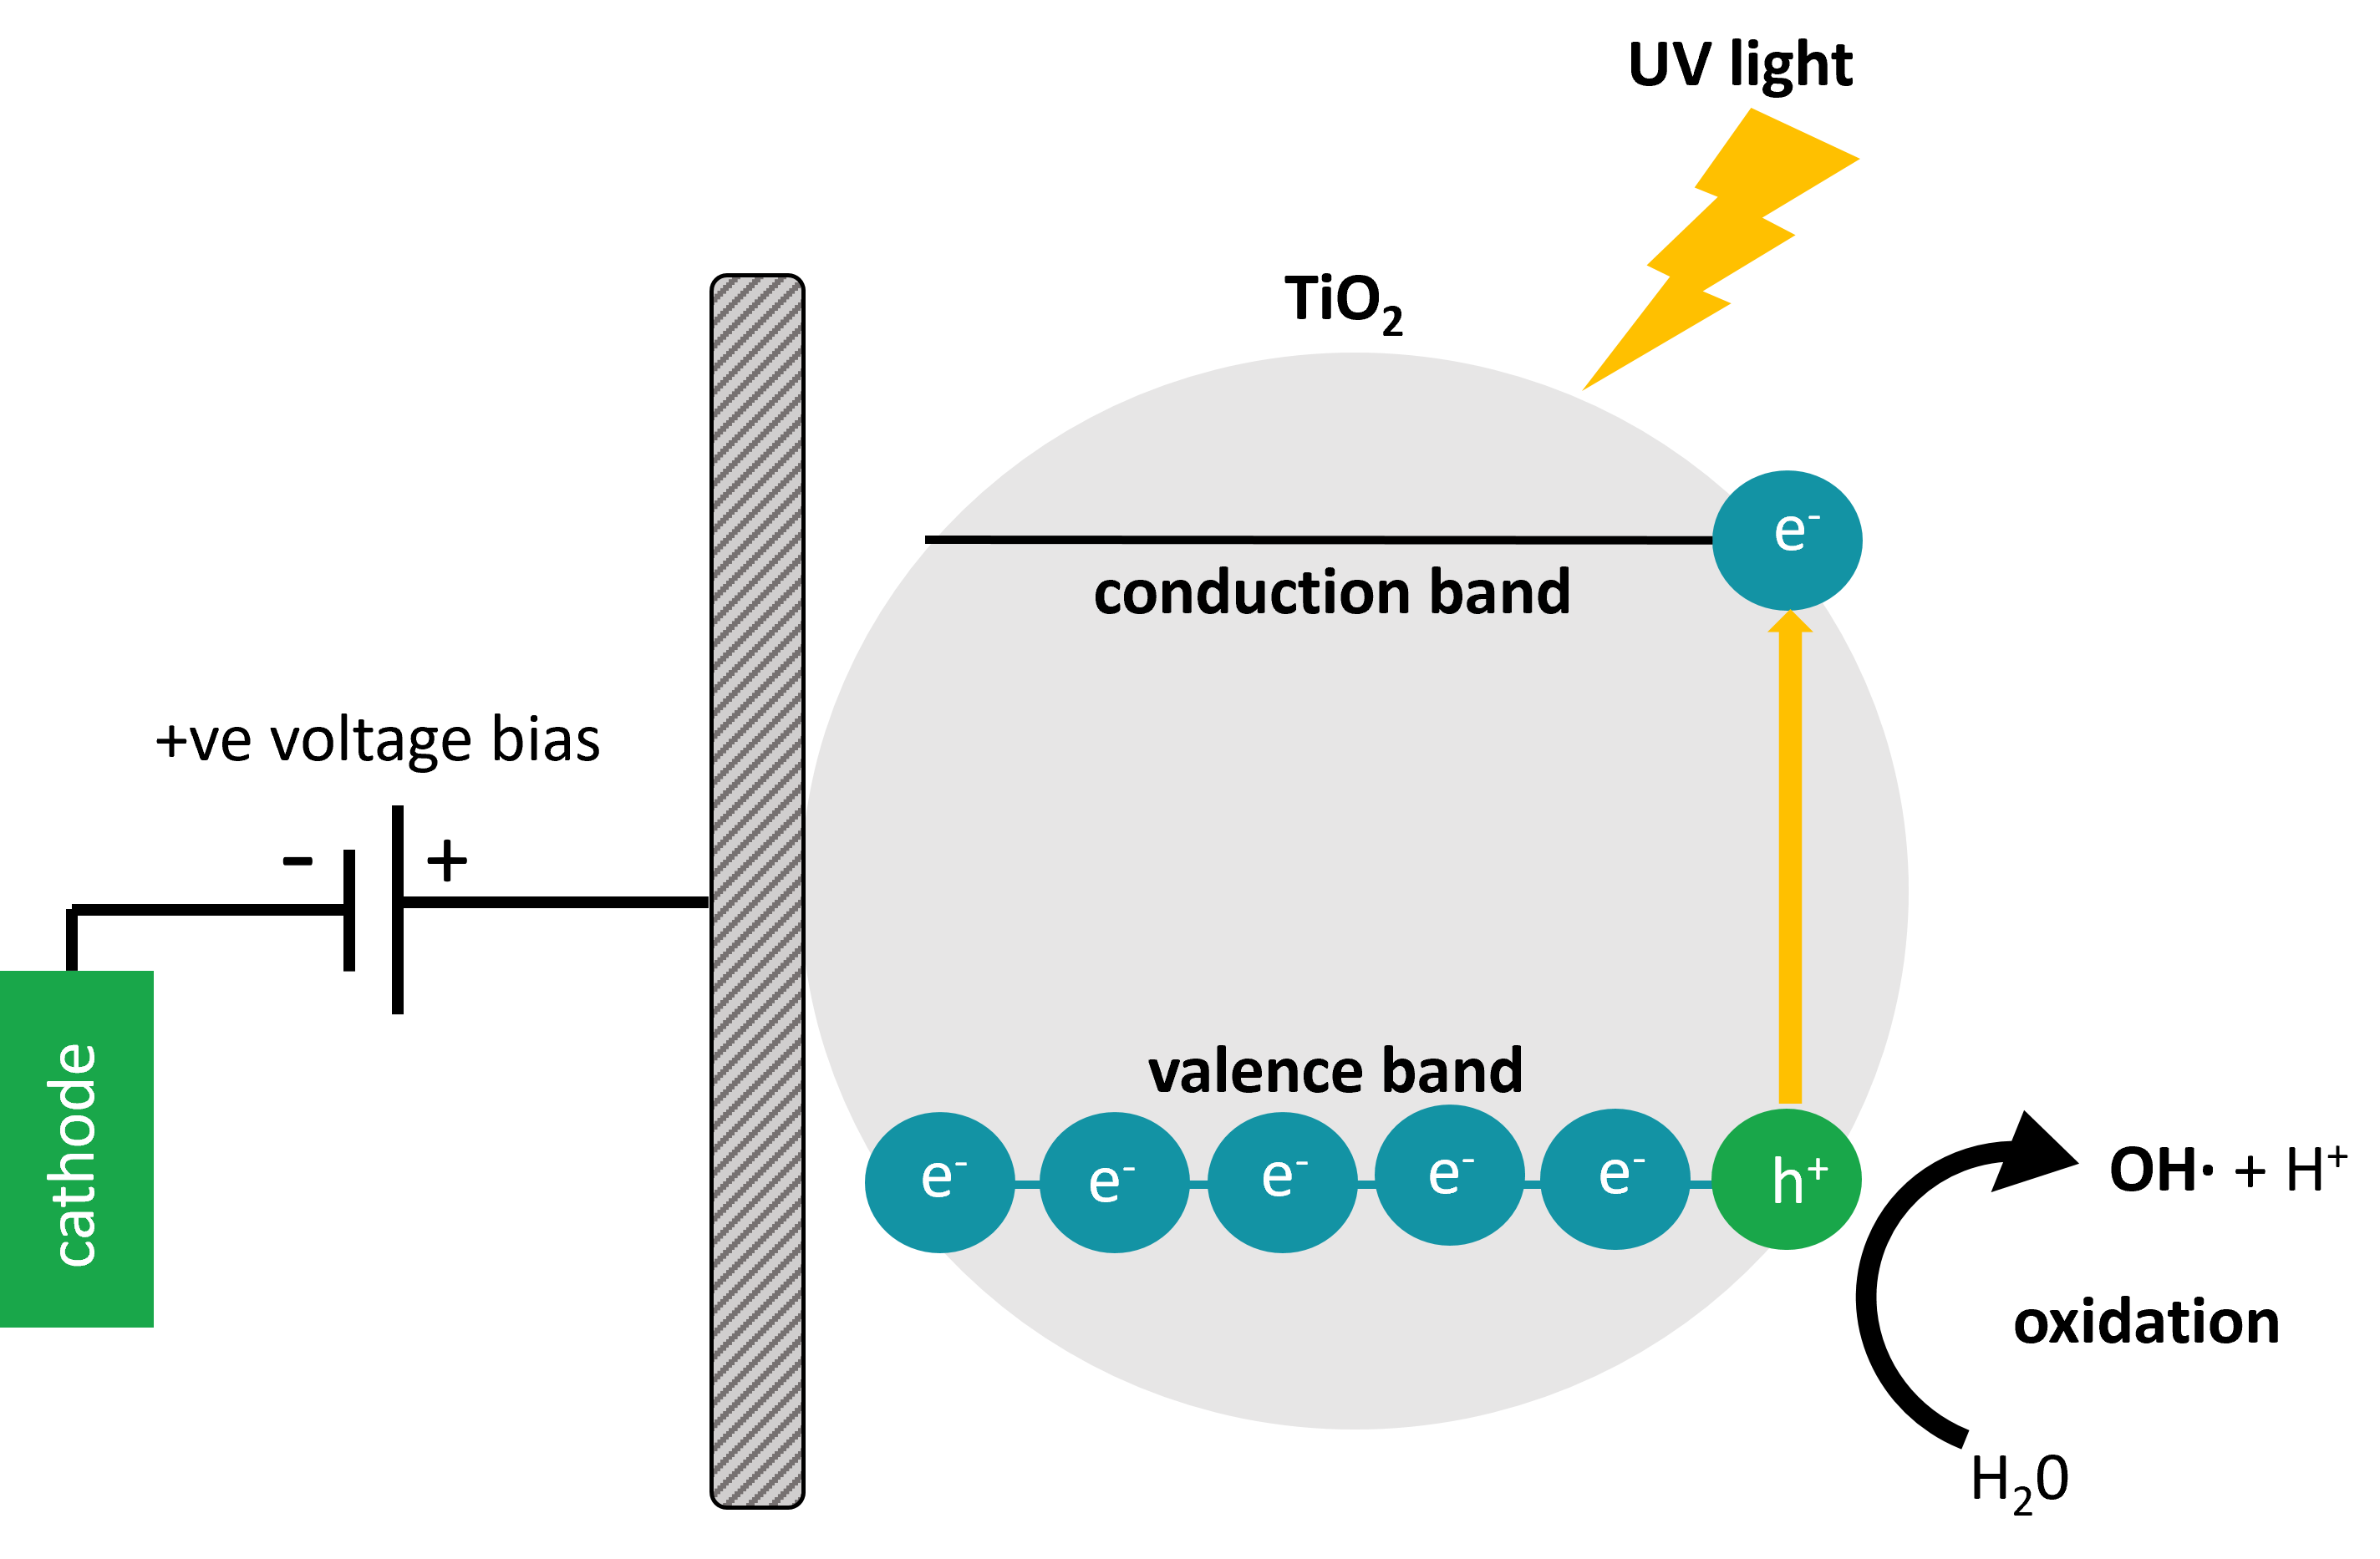
- What is the primary mechanism of PeCOD chemistry?
The primary driver of the peCOD method chemistry is advanced oxidation induced by photocatalysis with Titanium Dioxide (TiO2). Pure TiO2 is only photo-active at wavelengths below 380 nm. This is because a certain amount of light energy is required to bump the electrons around and cause the behaviors that we associate with photocatalysis. The UV LED in the PeCOD® COD Analyzer operates at a peak wavelength of 365 nm, with a minimum 360 nm and maximum 370 nm, ensuring that efficient photocatalysis is achieved.

- What pH range can the PeCOD method measure in?
pH Range: 4.0 – 10.0 (after mixing with electrolyte)
The peCOD method requires that the pH of a sample AFTER being mixed with electrolyte must be between 4 – 10. To determine if a sample must be pH-adjusted, mix the sample with peCOD electrolyte at the proper mixing ratio for your COD range, then test the pH of the mixture.
For example, the sample may have a pH of 3.0, but then after preparing with electrolyte, the pH is in the required range, therefore, it is acceptable for immediate peCOD measurement.
If samples have been preserved in acid, they should be neutralized using sodium hydroxide prior to analysis to avoid a low reading, as well as damage to the sensor. When the sample pH is below 4, the photocatalytic oxidation at the TiO2 sensor is affected, leading to poor reproducibility and charge values below theoretical expectation. Below a pH of 2, the TiO2 displays instability. When the pH is above 10, the charge measured for the reference and sample solution yield lower than expected values, again caused by interference at the TiO2 sensor. Sulphuric acid should be used to lower the pH of samples with a pH of 10 or more.
- What are the PeCOD electrolyte and calibrant solutions composed of?
The PeCOD electrolyte solution is mainly composed of a low-concentration lithium nitrate solution. The PeCOD calibrant and check standard solutions supplied by MANTECH are composed of sorbitol. These solutions contain a trade recipe preservative that allow for the longer shelf life, compared to solutions prepared manually. Calibrant and check standard solutions prepared manually, following the PeCOD Standard Recipe, can be used for up to two weeks.
View the PeCOD electrolyte slurry SDS here.
View the PeCOD calibrant slurry SDS here.
View the PeCOD QC check standard slurry SDS here.
View the PeCOD blank slurry SDS here.
- Will PeCOD correlate with my Dichromate COD results?
There is a strong correlation between the PeCOD COD results and the dichromate COD results. To determine this, the two methods were compared vs. the theoretical oxygen demand (ThOD) for 34 organic species. See MANTECH’s technical bulletin for more information on the study.
- How is the PeCOD® COD/BOD Analyzer calibrated?
Calibrations are comprised of 6 different stages. The first stage is called the “Normalization Phase” and lasts 100 seconds. During this time, the LED strength is adjusted to maintain a baseline electrical current of 20 mA. This is performed on the blank solution, containing range specific electrolyte and COD free deionized water. Once the LED is set, oxidation of the blank solution will occur. This is comprised of 3 stages, visualized by 3 distinct curves. The stages are known as the Burn-In, Pre-Burn, and Oxidation of port B. The blank acts as a zero reference for the calibration based on the charge generated from the DI and electrolyte mixture. The area under the curve is used to quantify charge. Once the Port B stages have completed, the Port A stages will begin. The calibrant and electrolyte mixture is introduced across the TiO2 sensor, where similar Pre-Burn and Oxidation curves are generated. The concentration of the calibrant is determined based on the sample COD/BOD range. Once the specified number of calibrations have completed, the calibrant solution can be run as a sample (referred to as a QC check). It is expected that the COD result will be + / – 5% of the standard COD/BOD value. To view an example of the stages of a PeCOD® calibration, view our video &list=PLLCp3SOh3VUis3EGUiMonY7KV28v4bwGM&index=7″>here.
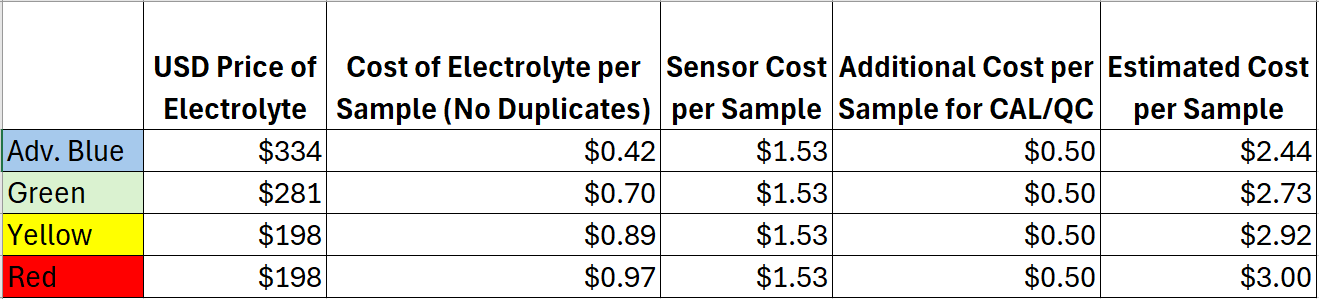
- What is the cost per sample using the PeCOD?
On average, the cost per sample can range anywhere from $2.44-$3.00 per sample. The cost per sample varies depending on the COD/BOD range and the number of samples analyzed, as this affects consumable usage such as calibrant, electrolyte and sensors. In general, the cost per sample decreases with an increase in the number of samples. There are several reasons for this, one being that the sensor should be replace monthly, therefore running more samples per month will yield a better return on sensor usage. In addition, the PeCOD® requires a daily calibration; by running more samples per calibration users save on consumable costs associated with calibrant. There are no disposal costs for the PeCOD, whereas disposal costs accumulate via the traditional dichromate method with every sample vial.

*All prices in USD
- How do inorganic compounds affect PeCOD® COD determination?
The following tables summarize the impact of a range of common inorganic anions and cations on the determination of COD using the PeCOD® technique. You can download this FAQ as a pdf document at this link.
For each inorganic species, solutions containing 0, 20, 50, 100, 250, 500 ppm (by mass) of the anion or cation, 60ppm COD (as sorbitol) and 1M LiNO3 (containing 20ppm COD spike) were prepared and analyzed, unless otherwise stated. Therefore, the below ion concentrations represent the concentration IN THE CELL (i.e. if analyzed in a different range, the interference levels may vary due to different electrolyte dilution effects).
Anions Formula Remark Ammonium NH4+ No interference for NH4+ ≤ 500 ppm Note: Similar results are obtained for Ammonia
Carbonate CO32- No interference for CO32- ≤ 500ppm using chloride resistant sensor Chlorate ClO3– No interference for ClO3– ≤ 500ppm Chloride Cl– Chloride ions interfere with COD readings in concentrations greater than 200mg/L. The COD is expected to be reduced by up to 20% when levels exceed 500mg/L. Samples with high chloride concentrations can still be run on the PeCOD. The allowable chloride concentration of the sample varies depending on the COD range being run on the PeCOD. When diluting a sample to be within the acceptable chloride concentrations, the dilution must occur prior to mixing with electrolyte. The different allowable Chloride ion concentrations are:
- Advanced Blue: 266mg/L
- Green: 400mg/L
- Yellow: 2000mg/L
- Red: 10,000 mg/L.
Other halides like fluoride, bromide, and iodide are expected to have similar concentrations and interference behaviours.
Nitrate NO3– No interference, NO3– can be used as PeCOD electrolyte Nitrite NO2– No interference for NO2– ≤ 500ppm Perchlorate ClO4– No interference, ClO4– can be used as PeCOD electrolyte Phosphate PO43- No interference for PO43- ≤ 500ppm Sulfate SO42- No interference for SO42- ≤ 500ppm Sulfite SO32- Interference for SO3 ≥ 20 ppm, giving COD high by 90% at 250 ppm SO32- Sulfide S2- Interference for S2- > 0 ppm, giving COD high by >100% at 50 ppm S2- Cations Formula Remark Aluminum Al3+ No interference for Al3+ ≤ 500ppm Calcium Ca2+ No interference for Ca2+ ≤ 500ppm Chromate Cr3+ Interference for Cr3+ > 2 ppm, giving low COD Ferric Iron Fe3+ No interference for Fe3+ ≤ 500ppm Ferrous Iron Fe2+ Interference for Fe2+ > 100 ppm, giving low COD Magnesium Mg2+ No interference for Mg2+ ≤ 500ppm Potassium K+ No interference for K+ ≤ 500ppm Silver Ag+ Interference for Ag+ > 10 ppm, giving low COD Sodium Na+ No interference for Na+ ≤ 500ppm Zinc Zn2+ No interference for Zn2+ ≤ 500ppm

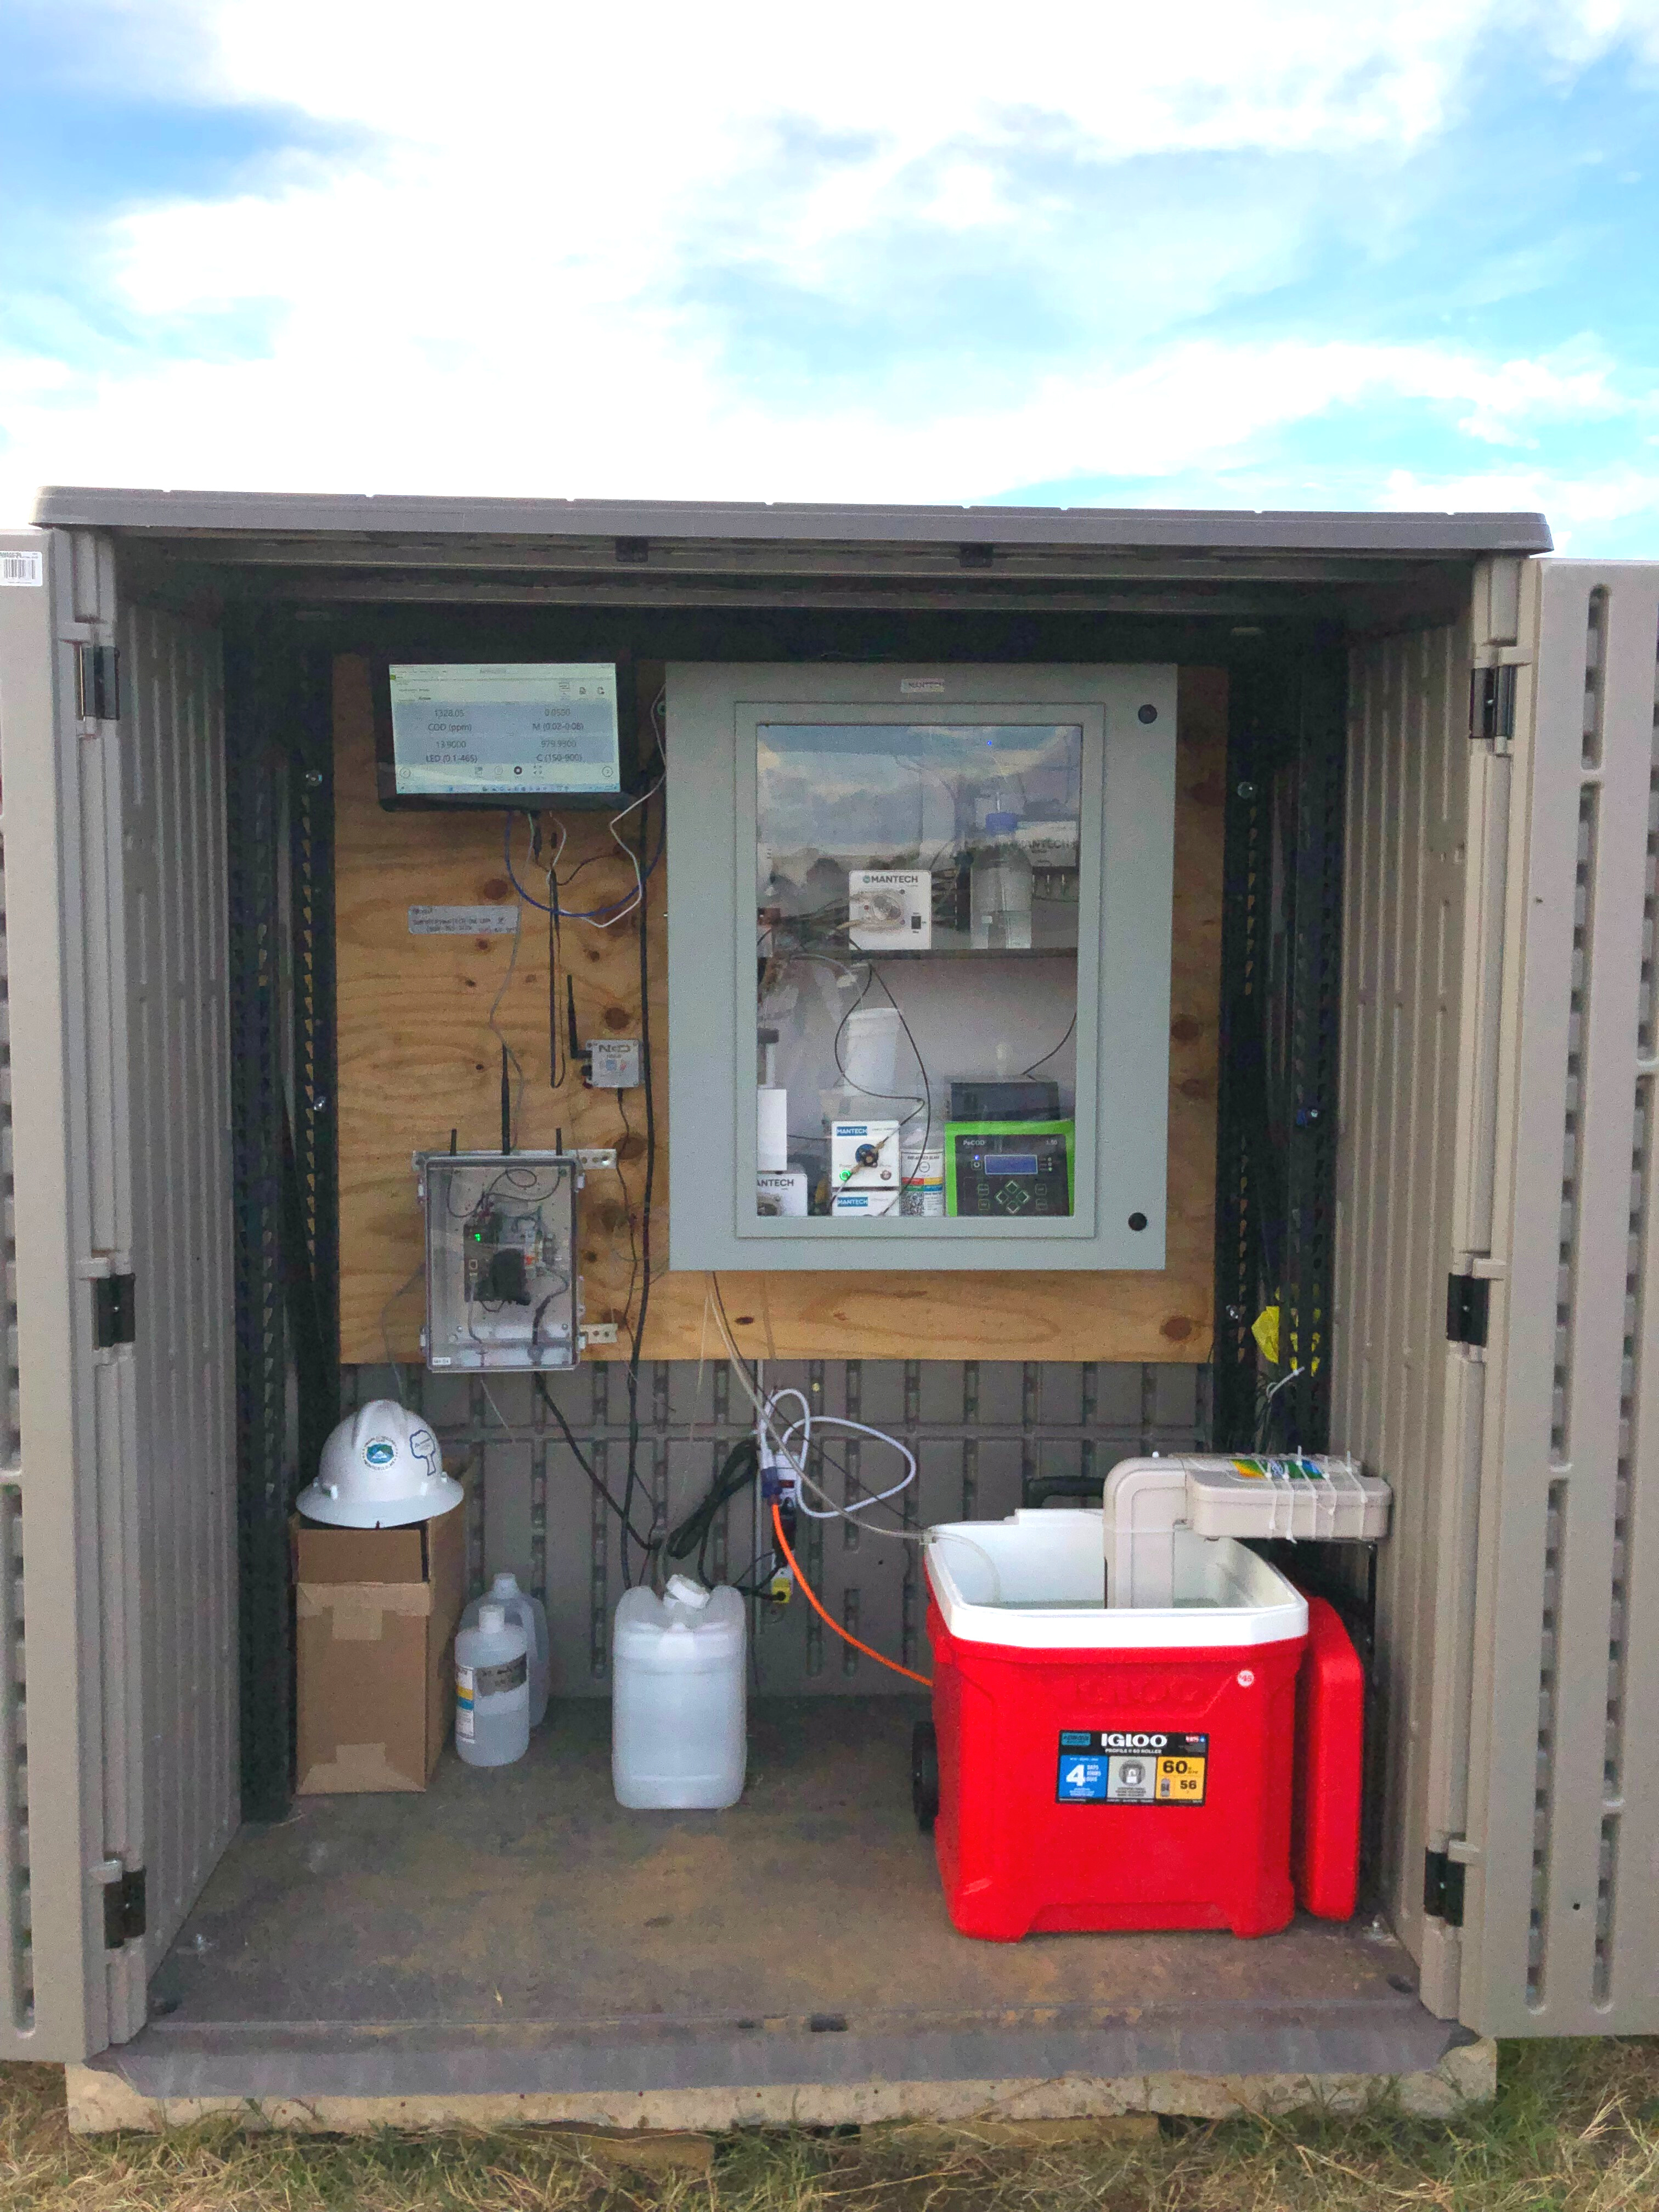
Online COD & BOD Analyzer for Real-Time Monitoring
MANTECH’s Online MO1000 PeCOD Analyzer
Online PeCOD® for chemical oxygen demand (COD) and estimated biochemical oxygen demand (BOD) analysis is designed to improve process control, optimize treatment and ensure compliant discharging with real-time results. Utilizing MANTECH’s innovative PeCOD® analyzer, the MO1000 delivers empirical results with the use of non-hazardous reagents. Simply set sampling intervals and receive results to your email and SCADA for hands-free analysis.
Combine several parameters (pH, alkalinity, conductivity, ammonia and more) for regulatory compliance.
Minimal User Interaction
Set sampling intervals with built-in features to minimize human interaction.
Empirical Results
A true measure of COD and estimated BOD NOT based on optical or surrogate measurements.
Maximize Your Investment
Combine analysis of pH, alkalinity, conductivity, ammonia and more.
Modbus TCP
+ Export in CSV and email results.
Online COD Analyzer Optimizes Treatment for Leading Pulp & Paper Mill
One of the world’s leading makers of tissue, pulp, packaging and building products adopts PeCOD® to deliver real-time COD results for aeration basin optimization. Generating a minimum of 100,000 liters of wastewater daily, monitoring COD (chemical oxygen demand) is critical for keeping the aeration basins operating at optimal levels.
This is a pilot project began with MANTECH’s benchtop PeCOD® analyzer to generate rapid, reliable and empirical COD results. Due to the overall scale of the treatment facility and success of PeCOD®’s actionable COD results, the pulp and paper mill invested in an online system for autonomous analysis, MANTECH’s MO1000. By leveraging hourly COD results on a 24hr basis 7 days a week with MANTECH’s MO1000 system, real-time feedback via Modbus communication protocols can be utilized to make timely and effective decisions on how operators optimize their aeration basins and overall treatment.
Multiple Configurations, Same Technology
Benchtop analyzer is also available to efficiently measure multiple treatment points for troubleshooting purposes. Whether online or benchtop, it’s the exact same technology – making it ideal for current PeCOD customers to easily upgrade to online configuration.
Other Applications
- Municipal & industrial wastewater treatment plants
- Pulp & paper mills
- Food & beverage producers
- Drinking water treatment plants
At the core of technology is the PeCOD® sensor. The oxidation process is comprise of a UV-activated nanoparticle TiO2 (titanium dioxide) photocatalyst coupled to an external circuit to measure the charge generated. This rapid advanced oxidation process (AOP) produces hydroxyl radicals to measure the oxygen demand utilizing green chemistry therefore, NO high temperature digestion of hazardous chemicals is required.
PeCOD® is no surrogate method, but rather an empirical analyzer to handle varying matrices. It is trusted in 100s of municipal and industrial treatment plants, academic institutions, pulp and paper mills, wineries, breweries, biogas refineries, mining and petrochemical operations, and more!
PeCOD® is utilized as a tool for internal process control and discharge compliance monitoring, not as an approved method for compliance reporting.
Method:
- Method type: Photoelectrochemical oxygen demand
- Measuring range: 0.7 mg/L- 15,000 mg/L (auto-dilution capability to extend range to 200,000+ mg/L)
- Precision: +/- 10%
Communication Protocols Supported:
- Modbus TCP
- CSV to network location
- Email to multiple inboxes
Requirements:
- Minimum of 30” W x 36” H x 16” D area protected from the elements
- Unpressurized tank or split stream reservoir (for sampling)
- Potable or deionized water source (for rinsing)
- Floor drain or carboy (for non-hazardous waste)
- Standard electricity source of 110-240V 50/60Hz
Sample Matrices Requirements:
- Particle size: <50μm (homogenizer can be provided)
- pH range: 4 – 10 (after reagent addition)
- Temperature: 5° to 50° C
Additional Monitoring Parameters:
- Alkalinity
- Acidity
- Ammonia
- Chloride by direct measure or titration
- Chlorine
- Color
- Conductivity
- Fluoride by direct measure or standard addition
- FOS/TAC ratio
- Hardness by photometric titration or potentiometric titration
- Kappa number determination
- Nitrate
- ‘Optimized’ total organic carbon (TOC) via PeCOD
- Oxidation-reduction potential (ORP)
- pH
- Salinity
- Sulfide
- Total acid number (TAN)
- Total base number (TBN)
- Turbidity
Additional Hardware:
- Homogenizer (required if particles in sample are >50μm)