
- Why are my Turbidity QCs failing?
One of the most common reasons for Turbidity QCs failing is due to DI water that is not degassed being used for blanks and standards preparation.
Any dilutions used to prepare turbidity standards, as well as blanks, must use degassed DI water. This is especially important for accurate low-end turbidity analysis, as there is often a positive bias due to bubbles introduced into the DI water solution when it is being produced/dispensed. This effect becomes more noticeable with lower NTU readings, and can cause challenges with performing an accurate calibration. To degas DI water, it must be dispensed into a very clean bottle or container, and left to sit for ~24h. You will see bubbles form on the side of the container as the water degasses. After degassing, it is ready to use for blanks and standards preparation.
When your turbidity QCs are failing, it is best to do the following:
- Ensure you are using Degassed DI water
- If you do not have this, prepare by leaving DI water to sit for 24h in a very clean bottle or container
- Repeat the QCs with a freshly-prepared standard
- If still failing, perform a new multi-point calibration, followed by x3 blanks then the same QC standards, all with fresh solutions
- If still failing the above, remove the flow cell and clean it, and also perform a new meter calibration with the set of sealed cuvette standards
- Then, reinstall the flow cell and perform a new free calibration, then a new multi-point calibration, followed by x3 blanks then the same QC standards, all with fresh solutions
- Ensure you are using Degassed DI water
- Why is it important to use Degassed DI Water for blanks and standards preparation when performing automated Turbidity analysis?
Any dilutions used to prepare turbidity standards, as well as blanks, must use degassed DI water. This is especially important for accurate low-end turbidity analysis, as there is often a positive bias due to bubbles introduced into the DI water solution when it is being produced/dispensed. This effect becomes more noticeable with lower NTU readings, and can cause challenges with performing an accurate calibration. To degas DI water, it must be dispensed into a very clean bottle or container, and left to sit for ~24h. You will see bubbles form on the side of the container as the water degasses. After degassing, it is ready to use for blanks and standards preparation.
- Why does my Turbidity method require a Multi-Line calibration?
The MANTECH turbidity flow cell has specific optical properties which are different than the cuvettes which you would manually insert (for example the sealed standards for the 3-month calibration). The difference in optical properties between the flow cell cylinder and the cuvette can cause the relationship between actual NTU and expected NTU to be slightly non-linear. This is only applicable in the low end of the measuring range, typically < 1 NTU. To ensure the lowest detection limit possible, we use multi-line to accurately capture how the optical properties of the flow cell are different than the cuvettes.
- What is the shelf life of MANTECH Turbidity Standards?
MANTECH Turbidity Standards have a one year shelf life from the date they are put in stock. The Expiry Date is always shown along with the lot number on the bottle labels.
- How do you calculate Total Suspended Solids (TSS) from Turbidity?
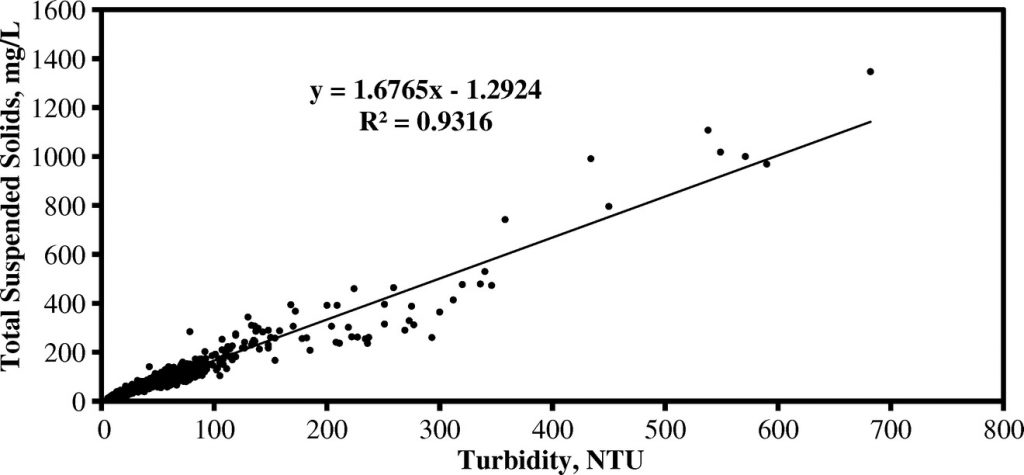
Total suspended solids (TSS) is an analysis method that requires filter, wet weighing, drying in an oven for a few hours, then dry weighing. This is typically not performed by treatment plants and even for labs it is time consuming.
Turbidity is a surrogate measure for TSS that allows rapid automated analysis of batches of samples. A log-linear model shows strong positive correlation between TSS and turbidity (R2=0.9374) with a regression equation of [ln (TSS)=0.979 ln (Turb.) +0.574]. This model can be applied directly to turbidity analysis results to determine the TSS. MANTECH offers the MT30 analyzer for quick and easy “hands off” TSS analysis, only requiring 40mL of sample volume in batches up to hundreds of samples.
An example scatterplot showing a Turbidity:TSS correlation is provided below:

- How can I determine true color or filtered color using a turbidity measurement instead of filtering the sample?
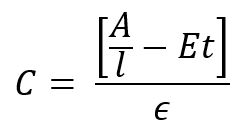
True or Filtered Color is determined by filtering samples through a 0.45 micron filter before analyzing the sample in a spectrophotometer. When running large amounts of samples on automated systems, this filtering can become time consuming and heavy on resource usage. An alternative method (Bennett and Drikas 1993) for determining true color without filtering has been established, through the use of a turbidity meter to quantify the contribution from solids present in the sample. MANTECH can easily combine automated Turbidity and Color analysis on one system, determined from one sample, to provide True Color results without the need to filter.
The determination is as follows:

C – Color result (Cu)
A – sample absorbance (Abs)
l – cell path length (cm)
E – scattering coefficient estimated at 0.00264 NTU-1 cm-1
t – turbidity (NTU)
ϵ – color absorptivity coefficient determined through calibration (Cu-1 cm-1)
- What is Turbidity?
Turbidity is defined as the amount of suspended particles in a solution, measured in nephelometric turbidity units (NTU). It is used as a general indicator of the quality of water, along with colour and odour. The US EPA has a maximum contaminant level (MCL) of 5 NTU for drinking and wastewaters. Read MANTECH’s turbidity method abstract here.
- What is the recommended type of standard for automated Turbidity Calibrations and Quality Control?
MANTECH recommends the use of turbidity standards made with suspensions of microspheres of styrene-divinylbenzene copolymer for all turbidity applications. Standard Methods dictate that “Secondary standards made with suspensions of microspheres of styrene-divinylbenzene copolymer typically are as stable as concentrated formazin and are much more stable than diluted formazin.”
Any dilutions used to prepare turbidity standards, as well as blanks, must use degassed DI water. This is especially important for accurate low-end turbidity analysis, as there is often a positive bias due to bubbles introduced into the DI water solution when it is being produced/dispensed. This effect becomes more noticeable with lower NTU readings, and can cause challenges with performing an accurate calibration. To degas DI water, it must be dispensed into a very clean bottle or container, and left to sit for ~24h. You will see bubbles form on the side of the container as the water degasses. After degassing, it is ready to use for blanks and standards preparation.
- What is the wavelength measured for Turbidity by Standard Methods (White Light)?
Standard Method 2130B (Nephelometric Method) specifies that a laboratory or process nephelometer should have a detector system with a spectral peak response of 400 to 600 nm. MANTECH’s T10 Turbidity meter and automated turbidity applications conform to this requirement.
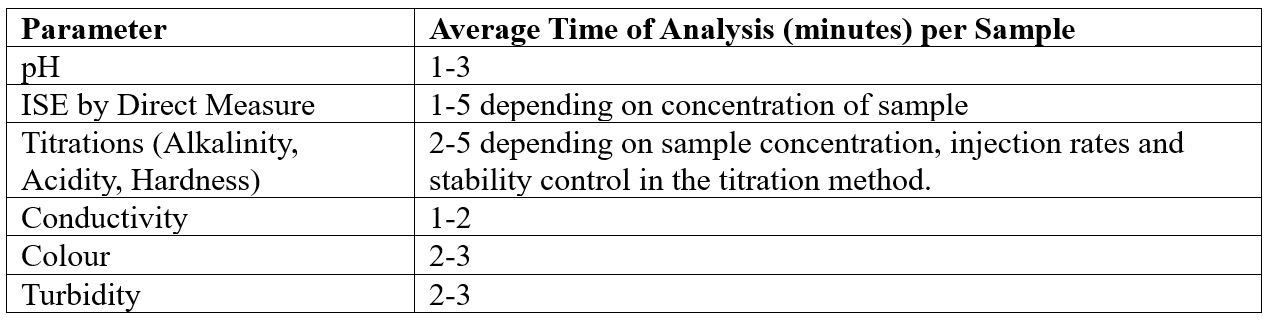
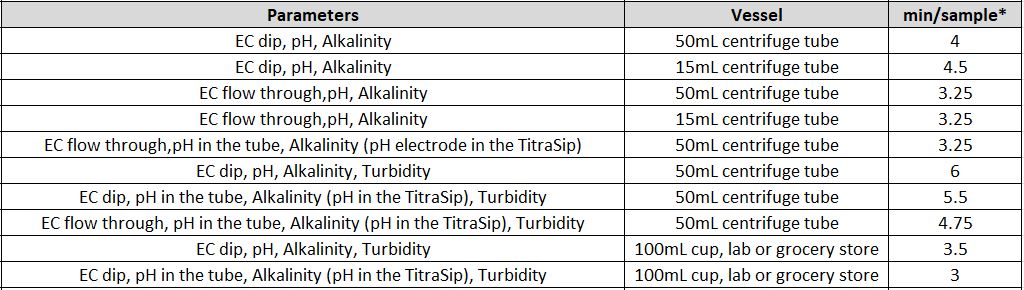
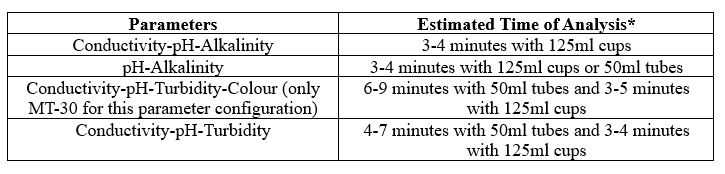
- What is the Time of Analysis for Different Parameters?
The timing for analysis of different parameters depends on a few different factors, like the concentration of the sample and the equipment used.
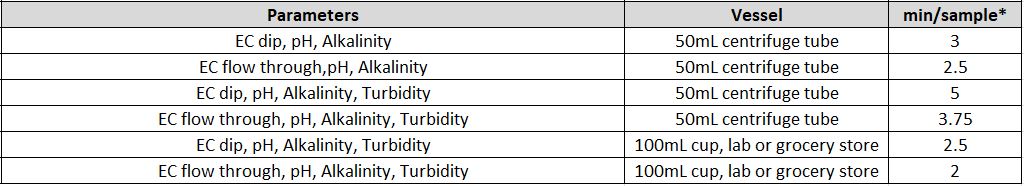
Another factor is the total available sample volume in the vessel on the AutoMax Autosampler bed. With some combinations of parameters, larger sample volume allows for simultaneous measurements, resulting in faster total analysis time than sequential measurement. A larger sample volume may require a larger sample cup, which decreases capacity on the same model Autosampler. In some, the cases the same set of parameters can be analyzed in 2-5 minutes faster when using the 125ml cups vs 50ml tubes.
It is important to understand your customers’ requirements in terms of capacity and throughput speed, total batch capacity required and/or daily sample loads and if overnight, unattended analyses will be applicable.
*** Note that all times of analysis are halved if Dual-Analysis option is included with system***
Individual Parameters

Combined Parameters
MT-10 & MT-30 Models

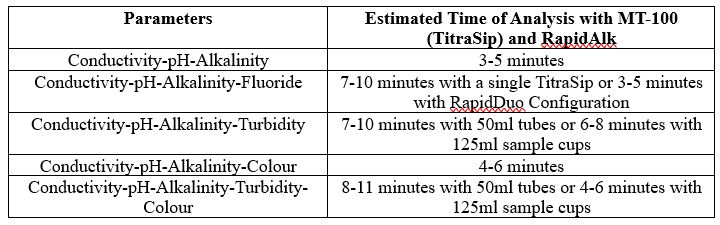
MT-100 Model

* Alkalinity titrations may take between 1-3 minutes depending on sample concentration. Times estimated assuming 50ppm alkalinity concentration.
EC = Electrical Conductivity
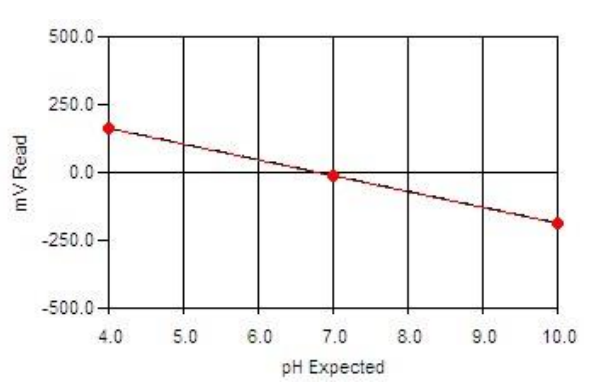
- What are the Different Types of Calibration Profiles?
Calibrations can be linear, logarithmic, single-line, and multi-line fit.
The calibration method used depends on the method required.
pH and Color calibrations are linear, single-line fit calibrations.

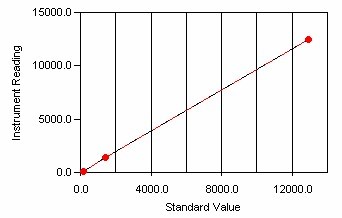
Conductivity and Turbidity calibrations are multi-line, linear type calibrations.

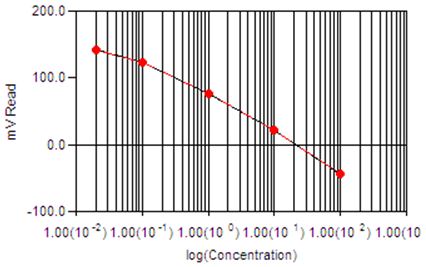
ISE (Fluoride, Chloride, Ammonia, etc.) use a logarithmic multi-line calibration type.

- What is the time of analysis per parameter and for multi-parameter analysis?
The timing for analysis of different parameters depends on several different factors, like the concentration of the sample and the equipment used.
Another factor is the total available sample volume in the vessel on the AutoMax Autosampler bed. With some combinations of parameters, larger sample volume allows for simultaneous measurements, resulting in faster total analysis time than sequential measurement. A larger sample volume may require a larger sample cup, which decreases capacity on the same model Autosampler. For example, an AM73 can accommodate 73x50ml tubes, or 30x125ml cups. In some, the cases the same set of parameters can be analyzed in 2-5 minutes faster when using the 125ml cups vs 50ml tubes.
It is important to understand your requirements in terms of capacity and throughput speed, total batch capacity required and/or daily sample loads and if overnight, unattended analyses will be applicable.
Individual Parameters
Combined Parameters
MT-10 & MT-30 Models

* If alkalinity is combined with turbidity and/or colour an MT-100 System must be quoted
MT-100 Model

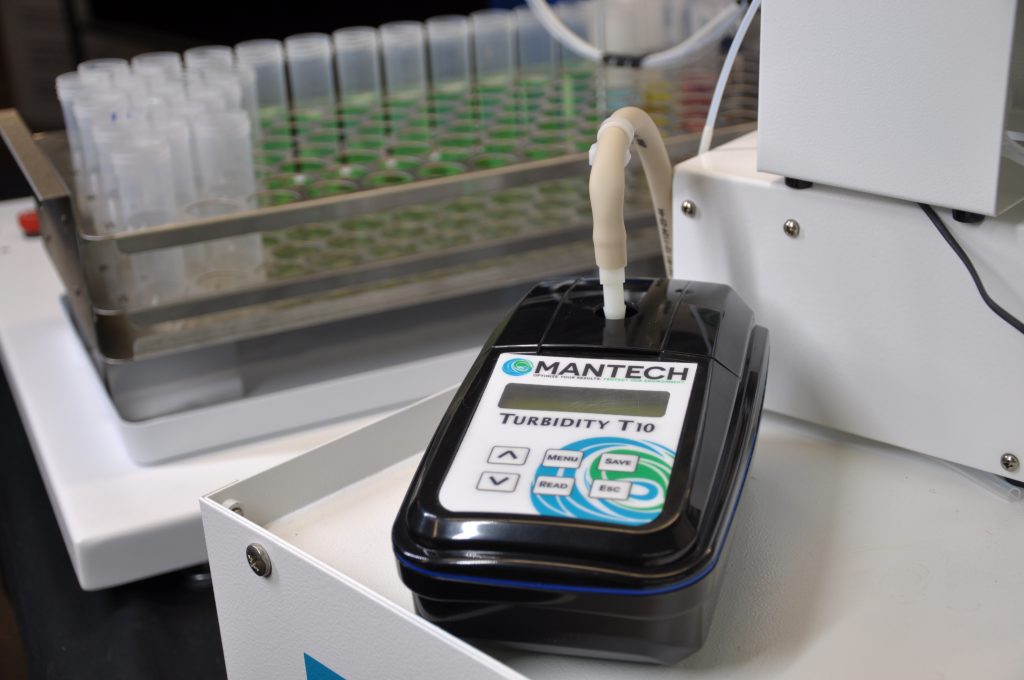
T10 – Turbidity Meter
MANTECH’s T10 turbidity meter features long-lasting lamps, with your choice of either White Light to conform to EPA method 180.1, ASTM D1889, and Standard Method 2130B or Infrared (IR) to conform to ISO 7027 and EN27027.
The T10 includes software FREE of charge for seamless run set up, reporting and more. Small sample volumes (only 30mL!) and the ability to reuse sample for additional analyses (pH, alkalinity, conductivity, fluoride, etc.) enable MANTECH customers to recognize economic and sustainable impacts.
Available in benchtop, automated, online and portable configurations.
Turbidity Thought Differently
Unlike standard top-in top-out flow-through turbidity cells, MANTECH’s proprietary cell features bi-directional pumping to deliver and reverse pump the sample form the bottom of the cell thereby eliminating air bubbles and fully evacuating the cell prior to the next sample.
Easy-to-use MANTECH Pro software platform features shortcut buttons, ability to store and retrieve data, import and export LIMS capabilities, and more. Easily upgrade to incorporate multiple parameters in a single analysis station or automated system (additional required hardware).
MANTECH’s T10 turbidity meter offers the smallest sample volume in the market. The unique flow-through cell allows for automated turbidity measurement from a batch of samples, requiring only 30mL of sample volume for analysis.
Coupled with MANTECH’s MT Series, turbidity can be combined with a suite of parameters such as pH, conductivity, alkalinity, and fluoride all being measured from the same sample vessel. Once the turbidity analysis is complete the majority of the analysis volume can also be returned to the sample cup, unaffected by measurement and ready for further analyses.
With a choice of either White Light or Infrared light sources, the T10 measure in the range of 0-1000 NTU resolution of 0.01 on the lowest range. Accuracy is ± 2% of reading: 0 to 1000 NTU. Repeatability ± 0.4% of reading or ± 0.003 NTU.
The T10’s compact size of 114 x 198 x 83mm make it easy to fit in any laboratory setting or become portable for in-field work.
The T10 meter utilizes an extremely long-lasting light source that lasts for the entire lifetime of the meter, no changing of bulbs is ever required.
The T10 White Light version conforms to EPA method 180.1, ASTM D1889, and Standard Method 2130B, and the Infrared version confirms to ISO 7027 and EN27027.
BOTTOM-IN BOTTOM-OUT DESIGN | NO AIR BUBBLES | NO SAMPLE CARRYOVER

Pictured: Left is MANTECH bottom-in-bottom-out and right is standard top-in top-out.
Industry Applications
- Beer
- Wine
- Spirits
- Soft drinks
- ….and more
- Municipal drinking and wastewater treatment plants
- Industrial wastewater treatment plants
- …and more
- Food processing plants
- Manufacturing facilities
- …and more
- Ground water monitoring
- Reservoir water quality testing
- River monitoring
Configurations
Depending on your demand and environment of your laboratory, MANTECH offers the same turbidity analyzer in three different configurations.
BENCHTOP

Use as a Standalone Meter
The benchtop standalone meter configuration is best suited for laboratories with limited testing demand for turbidity and/0r restricted bench space.
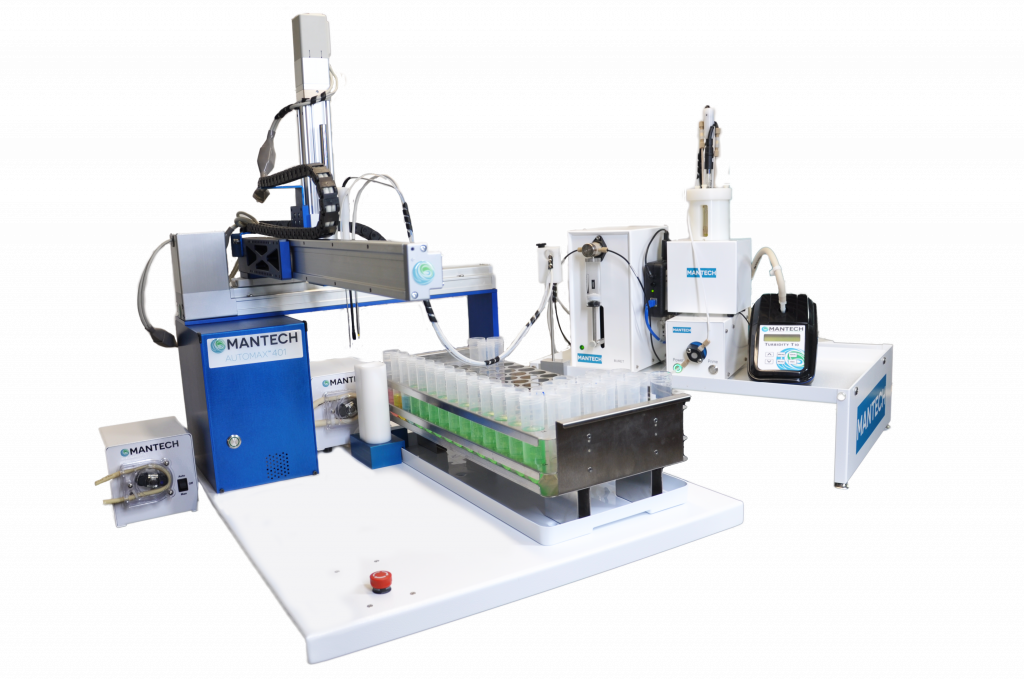
AUTOMATED
Add an Autosampler!
Integrate with our MT-Series to fully automate alongside other parameters such as pH, conductivity, and alkalinity. As a non-destructive test, once the turbidity analysis is complete the sample can be delivered back to sample tube for further analysis.
PORTABLE

Add a Carrying Case & Batteries!
The T10’s compact size (10x20cm) makes it easy to transition from work in the lab to out in the field. Results can be saved, then transferred to a computer via the USB connection.