Water Treatment Optimization
PeCOD® Case Study #14
Drinking water treatment in North America has stringent requirements for effluent water quality, with a great amount of attention being drawn to the presence of hazardous disinfection by-products (DBPs) persisting through water distribution systems. The operation of water treatment plants involves addition of various mixing agents to help with coagulation and settling of organics in the raw water supply, as well as the addition of chlorine for final disinfection.
Optimizing water treatment to reduce the risk of DBP formation without compromising safety of the treated effluent involves very careful reagent dosing. The dosage is based on the concentration of organics and other reactive material in the raw influent water. The required volume of mixing reagents fluctuates as the quality of raw water can be variable, especially during heavy weather events, with incorrect dosage of reagents having a significant impact on the effluent water quality. There is a need to continuously monitor parameters which reflect the variation in raw water quality to optimize the final effluent going to the public distribution system.
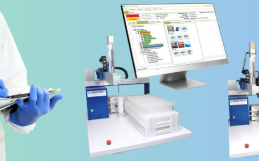
A metropolitan drinking water utility in the Midwest United States has been collecting water samples from the treatment plant at the raw influent, treated effluent, and throughout the city’s distribution system. This is aimed at determining key parameters for monitoring variations in water quality. The samples are tested for a wide variety of parameters. Those of greatest interest for optimizing the treatment process are Total Organic Carbon (TOC) and Chemical Oxygen Demand (COD), which are directly related to levels of organics in the water. The utility has traditionally used the dichromate method (CODCr) for COD analysis, and recently made the decision to replace this with the PeCOD (photoelectric Chemical Oxygen Demand) method for COD determination. The greatest motivation for this transition was to improve lab safety and environmental impact by eliminating the need for hazardous chemicals such as acid and mercury in the dichromate method. PeCOD is also advantageous over CODCr in measuring low concentrations. CODCr has a reportable limit of 10 ppm of COD, which is considerably higher than PeCOD, (accurate to <1 ppm). The PeCOD® Analyzer’s low detection limit is ideal for source water and treated water applications. Its green technology consistently provides COD results in under 10 minutes, and can be configured for laboratory, portable (field), and process control applications, with options for automated operation and online monitoring.
In addition to improved safety and environmental impact, the rapid analysis time of the PeCOD® Analyzer has the potential to be used for continuous treatment optimization, in the same way some utilities currently use TOC and UV254 instruments for source monitoring. For the Midwest water utility, the results of their general monitoring program have shown that TOC and COD trend independently of each other. The TOC results followed expected trends, showing a decrease in values from the raw water inlet to the distribution system indicating a decrease in organic matter through treatment. Interestingly, the COD results increased slightly from the raw inlet point to the distribution system, indicating greater reactivity even though the organic content was decreasing. This would indicate an increased DBP formation potential.
When it comes to treatment optimization, reactivity of the source water (measured by PeCOD) has been shown to provide a better understanding of how treatment will be affected by varying source quality due to seasonality or weather events. An example of this occurred at a Canadian water utility during a heavy storm event, where their online PeCOD measurement increased from 12 to 30mg/L while UV254 showed no change (Figure 1). The utility monitors TOC, but sends these samples for off-site analysis and therefore cannot use this analysis for real-time monitoring. With the knowledge of elevated COD values from the PeCOD® Analyzer, the operators were able to optimize the alum coagulant dosage and effectively manage their sludge blanket for the duration of the storm event. In another example, a Rocky Mountain water utility comparing UV254 and PeCOD for direct coagulant dosing control found that when a fluctuation was detected by both instruments, PeCOD was more sensitive to the change, which reflected the required dosing adjustments far more accurately than UV254. As a result, the utility switched to PeCOD monitoring for coagulation dosing control.
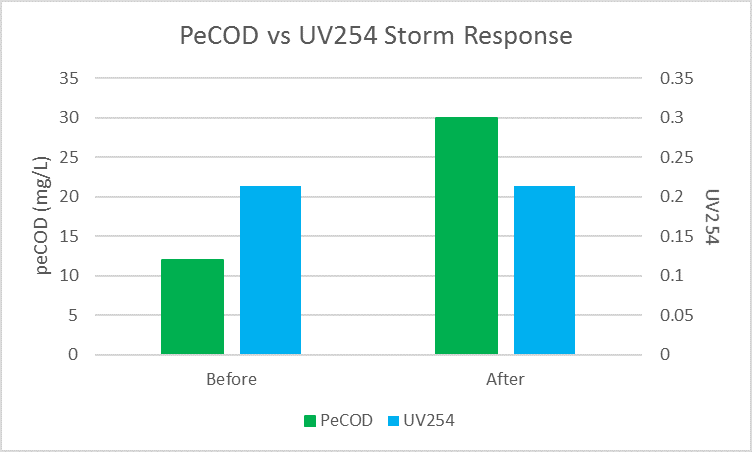
Figure 1: PeCOD and UV254 data at a Canadian water utility.
The Midwest water utility has included the PeCOD® Analyzer in its general monitoring program. They have begun evaluating its use as a continuous monitoring solution for raw influent, treated effluent and distribution system water quality with the purpose of treatment optimization. The monthly results of this monitoring program are made publicly available via the utility’s website.
Download the PDF here.
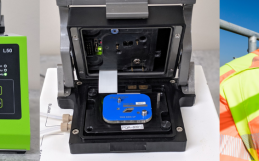
MANTECH’s PeCOD® Analyzer with MT-30 Autosampler (Discontinued L100 model displayed)