Online Chemical Oxygen Demand for Treatment Optimization
PeCOD® Analyzer Case Study #12 – Chemical Manufacturing Industry
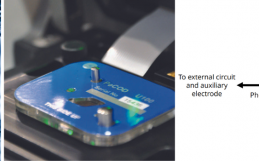
A wide variety of products are made in the chemical and pharmaceutical manufacturing industries, that require large volumes of chemicals, materials, and substances that are used throughout process operations. Waste water from these facilities typically include contaminants, toxins, nutrients, and organic content that presents challenges with regards to treatment. A major UK based chemical manufacturing facility had lost a large amount of product to the waste stream, and as a result, incurred charges from the local water authority. The justification to purchase an online Chemical Oxygen Demand analyzer, PeCOD®, was based on continuous monitoring of effluent COD to optimize treatment, detect spikes in organic contamination and contain product loss. An online PeCOD® Analyzer was installed at the final effluent, sampling every 2 hours throughout their 24/7 operations. This allowed the customer to obtain real time data, rather than having to wait 24 hrs for the analysis of the day’s composite sample from the laboratory. With continuous monitoring, they were able to fully understand how the Chemical Oxygen Demand levels vary during the day, which can be traced back to plant operations enabling impactful process optimization actions.
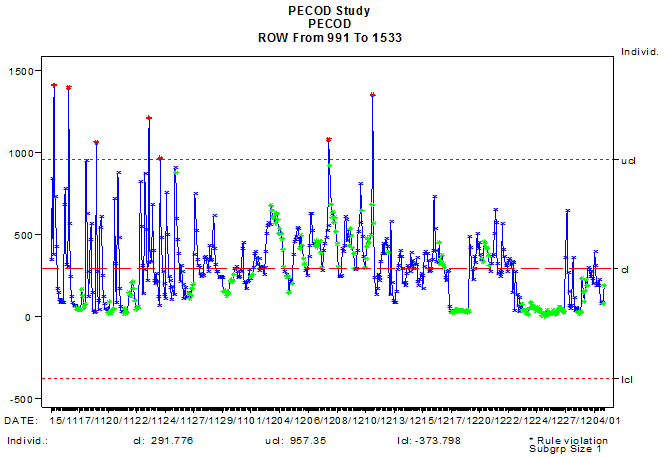
Figure 1: PeCOD results (mg/L) from continuous sampling of facility effluent (post-treatment). Samples every 2 hours for 56 days.

Figure 2: Trend chart for PeCOD® COD Analyzer results and Dichromate COD (CrCOD) results, determined from composite samples collected from the facility’s final effluent. A similar pattern is observed for each trend line.
As seen in Figure 1, the COD levels cycle during the day. COD spikes correspond to the sumps tank being drained of the wastewater runoff as it reached the capacity limit. Figure 2 demonstrates that photoelectrochemical Chemical Oxygen Demand (PeCOD) measurements trend in a similar manner to daily composite Dichromate COD results. PeCOD provided the operators with valuable information on how COD levels fluctuate and cycle during the day through unattended sampling every two hours. The project engineer reviewed the data and commented on the success of the PeCOD technology:
“The plot shows good agreement between the data and the stats confirm that. This is actually quite impressive.”
PeCOD successfully detected COD contamination being discharged from the site, with a strong correlation to Dichromate COD results. The significant benefits of the PeCOD technology include the rapid feedback for continuous monitoring, automated sampling and calibrations, and reliable results. The manufacturing plant has improved the health and safety of the employees by adopting this green method, and have demonstrated positive financial and sustainable practices.
Download the PDF here.