Event detection comparison of PeCOD, Total Organic Carbon, UV254 & SUVA
PeCOD® Case Study #10 – PeCOD is the New NOM Monitoring Tool for Measuring Organic Reactivity
Natural organic matter (NOM) is a critical parameter for measuring drinking water quality. Levels of NOM are associated with taste, odour, colour, chemical treatment dosage, and disinfectant by-product (DBP) formation. There are several tools accepted by drinking water quality experts which are used to evaluate NOM: total organic carbon (TOC), dissolved organic carbon (DOC), UV254, and specific ultraviolet absorbance (SUVA). Depending on the type of organics in the water, not all tools are suitable for measuring water quality. Most water treatment plants (WTP) use all or multiple measurements to determine NOM type and concentration. One of the challenges with current NOM measuring tools is their inability to measure the reactivity of all organics in the source and treated waters. Reactive organic contaminants are potential precursors to DPBs that can be carcinogenic.
A new NOM monitoring tool, the PeCOD® Analyzer, was evaluated at a Texas WTP in tandem with TOC, UV254, and SUVA. Photoelectrochemical Chemical Oxygen Demand (PeCOD) is an approved method by the Ministry of the Environment and Climate Change (MOECC Method E3515) and an approved ASTM International method for drinking water treatment plants (raw and treated water). The PeCOD method measures soluble COD, which is a measure of the reactivity of NOM contaminants. It has a published method detection limit of 0.7mg/L.
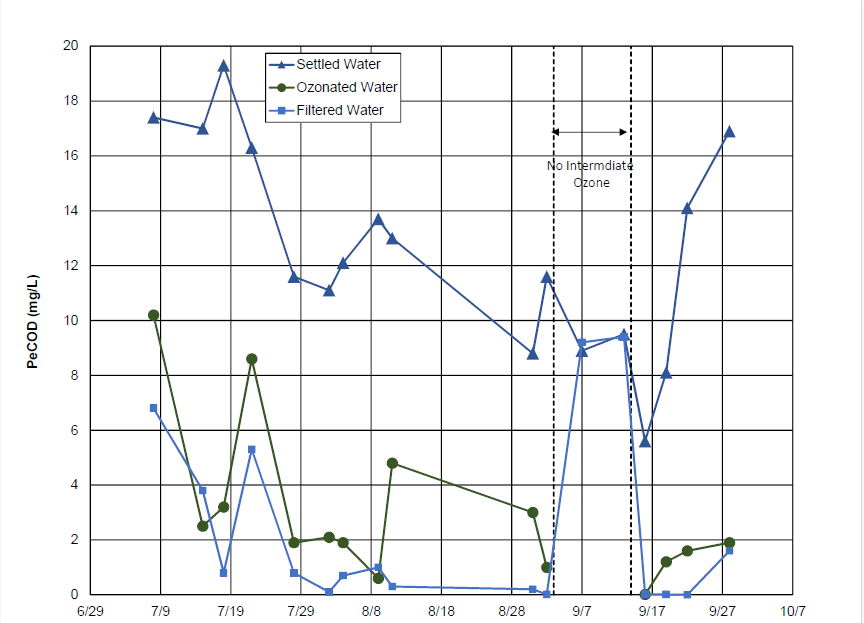
Figure 1: PeCOD (mg/L) measured for settled, ozonated, and filtered water effluents at a Texas WTP.
The L100 PeCOD® Analyzer was used alongside Total Organic Carbon, UV254, and SUVA over a four-month period, measuring water samples from each step in the treatment train, including, in order: settling, ozonation, and filtering. PeCOD, UV254 and SUVA measurements were completed at the WTP. Total Organic Carbon was measured at the central laboratory due to the complexity of the measurement and results were delivered 4 days after sampling. The PeCOD® Analyzer is simple enough to be used by the operators directly at the WTP, thereby providing data shortly after sampling. During two sampling dates within the testing period, ozonation was shut down while NOM was monitored at the succeeding step in the treatment train. Figure 1 summarizes the results recorded using the PeCOD method, while Figure 2 shows a comparison of results recorded from each monitoring tool.
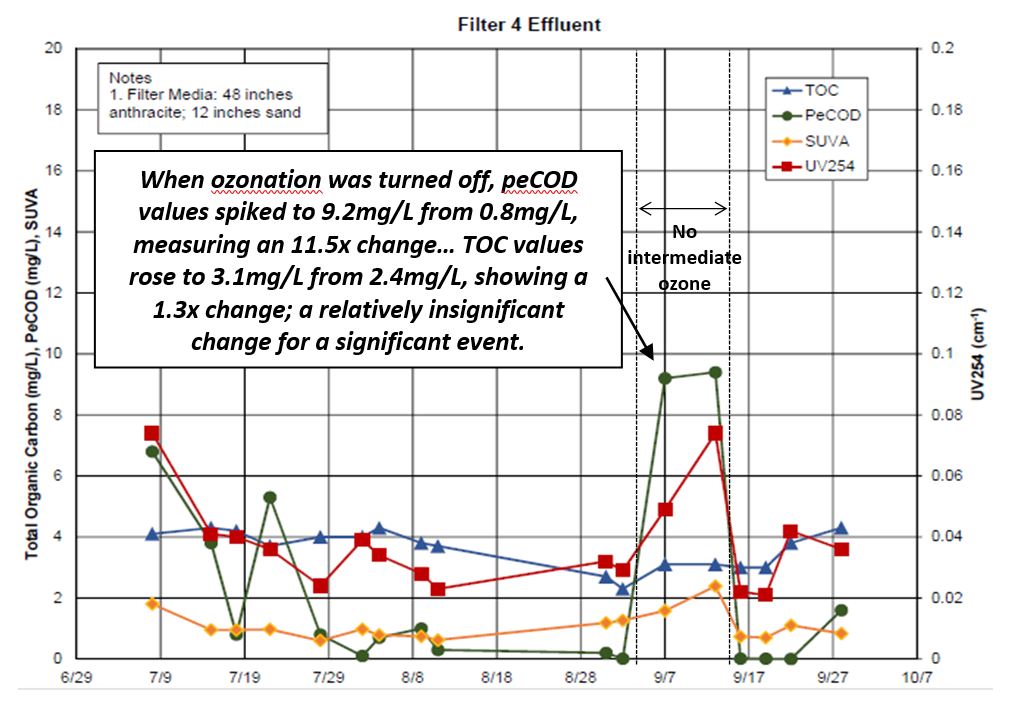
Figure 2: PeCOD, TOC, UV254, and SUVA results from a Texas WTP for filter 4 effluent, before, during, and after ozonation going offline.
Prior to ozonation shutdown, the PeCOD® Analyzer was measuring the COD of filtered water effluent at approximately 0.8mg/L. When ozonation was turned off, PeCOD values spiked to 9.2mg/L, measuring an 11.5x change. The change was significant and quickly measured. Total Organic Carbon values prior to the ozone treatment step going offline were approximately 2.4mg/L, whereas, when ozonation went offline, values went up to approximately 3.1mg/L. The change in TOC values was 1.3x; a relatively insignificant change for a significant event.
“When ozone treatment was paused, PeCOD detected the change faster and with greater magnitude than any of the other NOM surrogates.”
UV254 values before and after ozonation going offline were 0.03cm-1 and 0.07cm-1, respectively, with a net change in values of 0.04cm-1. It should be noted that two samples were tested and recorded for each NOM monitoring tool when ozonation was shutdown. While both PeCOD and TOC values went up and were relatively consistent between the two samples, UV254 measured 0.05cm-1 on the first sampling date and 0.07cm-1 on the second sampling date, indicating a delay in the response to treatment changes seen by UV254. The relative change in UV254 was markedly less than that measured by the PeCOD method.
Since SUVA is a function of UV254, it also showed a delayed response to ozonation going offline. Prior to ozonation being shutdown, it measured filtered effluent at 1.25. The first sample measured after ozonation going offline was 1.5, while the second sample measured was 2.4. The net change in SUVA between ozonation running and ozonation shutting down was approximately 1.15. This also was a markedly lower change than measured by the PeCOD® Analyzer.
The largest change in NOM measurement was seen with the PeCOD® Analyzer. The results from sampling when ozone was offline were 11.5x the results from sampling when ozone was online. The next largest change in NOM values was recorded using SUVA results that showed a difference of 1.15. The PeCOD® Analyzer was also able to detect when ozone went offline at the first sampling date, when PeCOD values at the filtered effluent went from 0.8mg/L up to 9mg/L. Having a large spike in NOM measurement makes it easier for operators to detect a treatment issue and make confident decisions accordingly. When ozone treatment was paused, PeCOD detected the change faster and with greater magnitude than any of the other NOM surrogates. Utilizing an online PeCOD® Analyzer with SCADA connectivity would support autonomous decision making.
It is also important to note that the PeCOD method is an empirical method independent of the matrix. As illustrated in the data, PeCOD was lower than TOC when ozone was online and significantly higher than TOC when ozone was offline. Since PeCOD is a measure of the oxidative state, or reactivity, of the organics, a value of 0.8mg/L indicates very few reactive organics are available that can form DBPs. This low value may be insignificant and even hint that ozone treatment is being used in excess. Ozone is an effective, but expensive treatment. Having a monitoring tool that is sensitive to organic reactivity could be used to optimize treatment to a higher acceptable PeCOD value and save the WTP considerable cost.
Author: Maggie Grierson B.Eng., Quality Control and Research EIT at MANTECH
Download the PDF here.