- What is the weight of BOD racks?
The weight of BOD racks varies depending on the capacity (12 or 18 position racks) and type of bottle (glass or disposable) once filled to 300mL.
12 Position Disposable Bottle Racks (PB-10255) 10.3 lbs 12 Position Glass Bottle Racks (PB-10248) 16.3 lbs 18 Position Disposable Bottle Racks (PB-10247) 15.6 lbs 18 Position Glass Bottle Racks (PB-10246) 24.6 lbs - What field bottles are recommended for automated sample transfer, pH adjustment, and dechlorination?
MANTECH offers custom racks to accommodate customer’s existing field bottles as well as standard options for 500mL and 1L bottles. See details below.
500mL Bottles
- Dimensions: 2.41”/6.12cm Dia. x 7.58”/19.25cm Bottle Hgt. x 0.47″/1.19cm Cap Hgt.
- Capacity per rack: 18 bottles
- View bottles here
1L Bottles
- Dimensions: 3.58”/9.1cm Dia. x 7.83”/19.9cm Bottle Hgt.
- Capacity per rack: 10 bottles
- View bottles here
It is important to keep in mind the total volume required to prepare all dilutions.
- What are the wavelengths used by the T10 turbidity meter?
The IR (infrared) light version of the T10 turbidity meter uses an emitter and detector specifically at 860nm. The WL (white light) version of the meter uses a tungsten lamp and a photodiode detector, both of which operate within the full visible light spectrum. The photodiode detector has a spectral peak response between 400-600nm.
The T10 turbidity meters are designed specifically to conform to the international requirements for reporting turbidity measurements. The IR version conforms to ISO 7027 and EN27027. The WL version conforms to APHA SM 2130B, ASTM D1889, and EPA 180.1. Both can be used on the same system if conforming to multiple standards is required.
Contact MANTECH for more information!
- What methods of lime analysis can be automated?
MANTECH systems conform to Tex-600-J and Tex-406-A Part III. Automated titrations (and back titrations) utilizing hydrochloric acid, sodium hydroxide, and other solutions are automated via MANTECH’s high precision 100,000 step buret with pH measuring range from 0-14.
Tex-600-J includes sampling and testing of:
- hydrated lime
- quicklime
- commercial lime slurry
- carbide lime slurry
- How many burets and pumps can be added to an analyzer?
All MT models can include up to 20 burets, 30 IntelliPeri™ pumps and 30 IntelliDose™ pumps.
- What is measuring range of the Model C10 conductivity meter?
The measuring range is 0.000µS/cm to 2,000mS/cm. The supplied conductivity probe has the same measuring range. The conductivity has a built-in PT1000 temperature probe for automated temperature compensation.
- How do I prepare liquid ATU from the reagent powder?
Dissolve one gram of 98% allylthiourea into 500 ml of DI water. This stock solution is good for 14 days, and must be refrigerated.
Dilute 10 ml of stock solution for every 100 ml of liquid inhibitor required for the number of samples to be set up each day. For example, if 250 mL of inhibitor is required, use 25 mL of stock solution.
The dilute solution must be prepared daily, as the solution is not stable.
Allylthiourea 98% – CAS# 109-57-9 – GFS Part # 5192
- Does MANTECH offer service and support globally?
MANTECH has regional Technical Representatives located throughout the U.S. and Canada to provide quick and quality support services. To find your regional MANTECH representative, visit our website here.
For customers outside of the U.S. and Canada, MANTECH has distributors in 50+ countries that have completed extensive training to provide localized support services. To find a MANTECH distributor near you, visit our website here.
- Does MANTECH offer service agreements?
Yes, MANTECH offers single and multi-year service agreements for one or multiple customer’s systems. For more information, visit our website here.
- How do I contact service?
To get in contact with a representative regarding service for MANTECH products:
- Visit our website here
- Email us at [email protected]
- Call us at +1 519-763-4245 or +1 866 763-2122 (toll-free)
- What is included with a service agreement?
In addition to an annual preventative maintenance visit (on-site or remote), the following is included with a service agreement:
- 5% discount on PM service parts
- 15% discount on additional serviceable parts during scheduled PM visit
- 15% discount emergency visits, in-house service and loaner modules
- Complete evaluation of methods, as required
- Perform software maintenance, as required
- Additional training if required (time permitting)
- Toll-free telephone and web-based support
- What is included with a preventative maintenance?
Preventative maintenance visits include inspection, cleaning, calibration, and replacement of consumable parts (included in MANTECH’s PM kits).
MANTECH can arrange for a member of MANTECH’s team of regional Technical Representatives located throughout the U.S. and Canada will come on-site to interact face-to-face with your team and perform all necessary maintenance to your system or connect remotely with your team to provide a detailed, step-by-step walkthrough of system maintenance to same quality of an on-site visit.
- Can I get a preventative maintenance without a service agreement?
Yes, preventative maintenance services can be purchased without a service agreement. There is no additional fee for a service agreement – only additional benefits including:
- 5% discount on PM service parts
- 15% discount on additional serviceable parts during scheduled PM visit
- 15% discount emergency visits, in-house service and loaner modules
- Complete evaluation of methods, as required
- Perform software maintenance, as required
- Additional training if required (time permitting)
- Toll-free telephone and web-based support
- What is the difference between membrane and optical DO probes?
MANTECH supports both membrane and optical DO probes as both are approved by SM 5210B.
Maintenance – The main benefit of optical over membrane is the maintenance aspect.
- Membrane probes are much more sensitive to storage conditions, operating practices, and the membranes need to be changed quite often.
- Optical sensor caps last a lot longer and storage is not as critical, though our systems do still store automatically regardless of probe type.
Stability Time
- Stability timing for each measurement is similar, can take a bit longer for optical vs membrane.
- Stability of the measurements over an entire run or between multiple runs is better with the optical.
For these reasons, MANTECH recommends the optical probe and ~90% of MANTECH customers use optical probes. Ultimately, it is your preference and MANTECH BOD systems support either probe.
- Is PC-BOD software compatible with Windows 10 or 11 OS?
As a result of major security updates Microsoft has implement, MANTECH cannot guarantee that PC-BOD will operate if updates in Windows 10 or 11 Pro operating systems. PC-BOD can operate in virtual mode however, this leaves the analyzer vulnerable to viruses (leading to corrupted databases) and could impact the software when Windows updates are performed. Here is some more information about everything you need to know before updating to Windows 10…read more. In 2021, MANTECH introduced a line of all new hardware and BOD Pro software designed for Windows 10 and 11 Pro OS – meaning that all security and OS updates can run concurrently.
There are a few different options to move forward:
- Install PC-Titrate on Windows 10 computer (no guarantee).
- Replace the entire system (all new hardware and software) with a trade-in discount for your existing system.
To discuss your options, please contact our team here.
- Is PC-Titrate software compatible with Windows 10 or 11 OS?
As a result of major security updates Microsoft has implement, MANTECH cannot guarantee that PC-Titrate will operate if updates in Windows 10 or 11 Pro operating systems. PC-Titrate can operate in virtual mode however, this leaves the analyzer vulnerable to viruses (leading to corrupted databases) and could impact the software when Windows updates are performed. Here is some more information about everything you need to know before updating to Windows 10…read more. In 2021, MANTECH introduced a line of all new hardware and MANTECH Pro software designed for Windows 10 and 11 Pro OS – meaning that all security and OS updates can run concurrently.
There are a few different options to move forward:
Install PC-Titrate on Windows 10 computer (no guarantee).
Upgrade the software to MANTECH Pro software which is backwards compatible with most hardware.
Replace the entire system (all new hardware and software) with a trade-in discount for your existing system.To discuss your options, please contact our team here.
- How do I download TeamViewer?
MANTECH is available to connect remotely to your instrument computer to answer questions, resolve challenges, and assist with any custom requests. TeamViewer is the software we use to connect remotely. Download the free version of TeamViewer here and we will walk you through the rest!
- Why are my Turbidity QCs failing?
One of the most common reasons for Turbidity QCs failing is due to DI water that is not degassed being used for blanks and standards preparation.
Any dilutions used to prepare turbidity standards, as well as blanks, must use degassed DI water. This is especially important for accurate low-end turbidity analysis, as there is often a positive bias due to bubbles introduced into the DI water solution when it is being produced/dispensed. This effect becomes more noticeable with lower NTU readings, and can cause challenges with performing an accurate calibration. To degas DI water, it must be dispensed into a very clean bottle or container, and left to sit for ~24h. You will see bubbles form on the side of the container as the water degasses. After degassing, it is ready to use for blanks and standards preparation.
When your turbidity QCs are failing, it is best to do the following:
- Ensure you are using Degassed DI water
- If you do not have this, prepare by leaving DI water to sit for 24h in a very clean bottle or container
- Repeat the QCs with a freshly-prepared standard
- If still failing, perform a new multi-point calibration, followed by x3 blanks then the same QC standards, all with fresh solutions
- If still failing the above, remove the flow cell and clean it, and also perform a new meter calibration with the set of sealed cuvette standards
- Then, reinstall the flow cell and perform a new free calibration, then a new multi-point calibration, followed by x3 blanks then the same QC standards, all with fresh solutions
- Ensure you are using Degassed DI water
- Why is it important to use Degassed DI Water for blanks and standards preparation when performing automated Turbidity analysis?
Any dilutions used to prepare turbidity standards, as well as blanks, must use degassed DI water. This is especially important for accurate low-end turbidity analysis, as there is often a positive bias due to bubbles introduced into the DI water solution when it is being produced/dispensed. This effect becomes more noticeable with lower NTU readings, and can cause challenges with performing an accurate calibration. To degas DI water, it must be dispensed into a very clean bottle or container, and left to sit for ~24h. You will see bubbles form on the side of the container as the water degasses. After degassing, it is ready to use for blanks and standards preparation.
- How is DI water connected to MANTECH Analyzers for rinsing?
MANTECH Analyzers utilize peristaltic pumps for rinsing that can pull DI water either from a static reservoir or container located near the analyzer, or from a pressurized line connected directly to the rinse pump inlet.
IMPORTANT NOTE: If drawing DI water from a pressurized line, it is important that the pressure in the line does not exceed 20 psi. A pressure regulator valve can be installed between the line hookup and the rinse pump to reduce pressure below this limit.
- What is the Conductivity (uS/cm) of Dilution Water?
Typically, dilution water is about 130-135 uS/cm. If using seeded dilution water, expect around 100 uS/cm.
Note: The conductivity threshold of MANTECH’s level sensor is 50 uS/cm. Dilution water made must have a conductivity value greater than 50 uS/cm. Deionized water will not trigger the level sensor.
- What are the Specifications for Ethernet and USB Hubs?
See below for hub specifications:
Specification Ethernet Hub USB Hub Ports 5 10 Power Input (AC) 100-240V 100-240V USB N/A USB 2.0 Driver Required No No Note: All hubs must be directly connected to power for all system installations. MANTECH does not recommend hubs acquiring power solely from the USB connection of the computer.
- Are BOD results affected by atmospheric pressure changes?
Generally speaking, dissolved oxygen readings are dependent on atmospheric pressure. This is because the density of water changes with pressure, and this in turn affects the mg/L of dissolved oxygen. Here is a resource describing the “why” behind this. It is also dependent on temperature for similar reasons.
The YSI meter does compensate for changes in atmospheric pressure. Here is a document explaining this. The document also provides advice for troubleshooting when challenges are occurring in BOD testing. One important aspect is to make sure you are calibrating the probe before each day of testing.
- What information is required to automate multi-parameter and titration-based applications?
Automating multi-parameter and titration-based applications can greatly increase the efficiency and throughput of a laboratory. To automate these analyses, the following information is required:
- Which parameters are you looking to automate? Here is a list of parameters we offer?
- Are there any SOPs you can provide for the requested applications?
- How many samples do you run per day, week, batch, etc.
- Does your company run any BOD or COD testing?
- What information is required for PeCOD analysis?
PeCOD can greatly increase the efficiency and transparency of chemical oxygen demand (COD) or estimated biochemical oxygen demand (BOD) results of a laboratory, factory, wastewater treatment plant and more. To perform this analysis, the following information is required:
- What is the COD or BOD concentration range to measure?
- How many samples will be analyzed per day or per week? Whichever applies.
- Why do you measure COD currently? For example, production control, effluent compliance, etc.
- Do you do on-site treatment? If so, What is the treatment train?
- How to add gran alkalinity method to MANTECH Pro?
Follow this step-by-step PDF on adding gran alkalinity method to MANTECH Pro Software.
- How do I change the C value settings in MANTECH Pro and PeCOD Pro?
MANTECH now has a new PeCOD Sensor recipe that allows for more sample sensitivity. With this change, a parameter will need to be updated for use. The C value on the calibration and new sensor settings will no longer need to have an upper limit as the more sensitive burn on the sensor increases the C value. Click here to view a PDF on how to change your C value settings in PeCOD Pro and Mantech Pro.
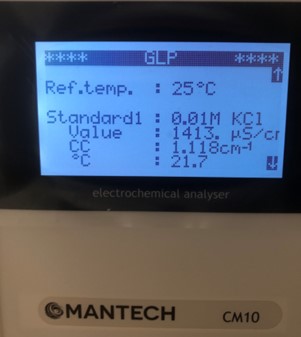
- How to retrieve cell constant from consort conductivity meter?
The cell constant can be retrieved from the GLP report, directly found on the meter. Press CAL, then press the Down Arrow key to select GLP, and press OK. Press OK again on Show Report.
This will bring up the calibration information was the performed on the meter, including the cell constant value. You need to scroll down, using the Down Arrow key, to find the section called “Calibration”, where CC = Cell Constant (cm-1).
Note: Scrolling to the bottom will show the previous cell constant.

- What are QC racks and what capacities are available?
Available as an optional add-on, MANTECH offers a separate fixed rack located in front of the rinse station for placing calibration solution, storage solution(s), and QC checks instead of limiting the sample rack capacity. Capacities range based on autosampler and tube/cup size.
MT Series QC Rack Options
Part Numbers # of Positions Tube/Cup Size Autosampler Model PC-AM400-QC-50-24 24 50mL All AM400 Models PC-AM400-QC-50-36 36 50mL AM402, AM403, AM404, AM405 PC-AM400-QC-50-48 48 50mL AM403, AM404, AM405 PC-AM400-QC-120-9 9 120mL All AM400 Models PC-AM400-QC-120-18 18 120mL AM402, AM403, AM404, AM405 PC-AM400-QC-120-27 27 120mL AM403, AM404, AM405 PC-AM400-QC-125-7 7 125mL All AM400 Models PC-AM400-QC-125-14 14 125mL AM402, AM403, AM404, AM405 PC-AM400-QC-125-21 21 125mL AM403, AM404, AM405 BOD QC Rack Options
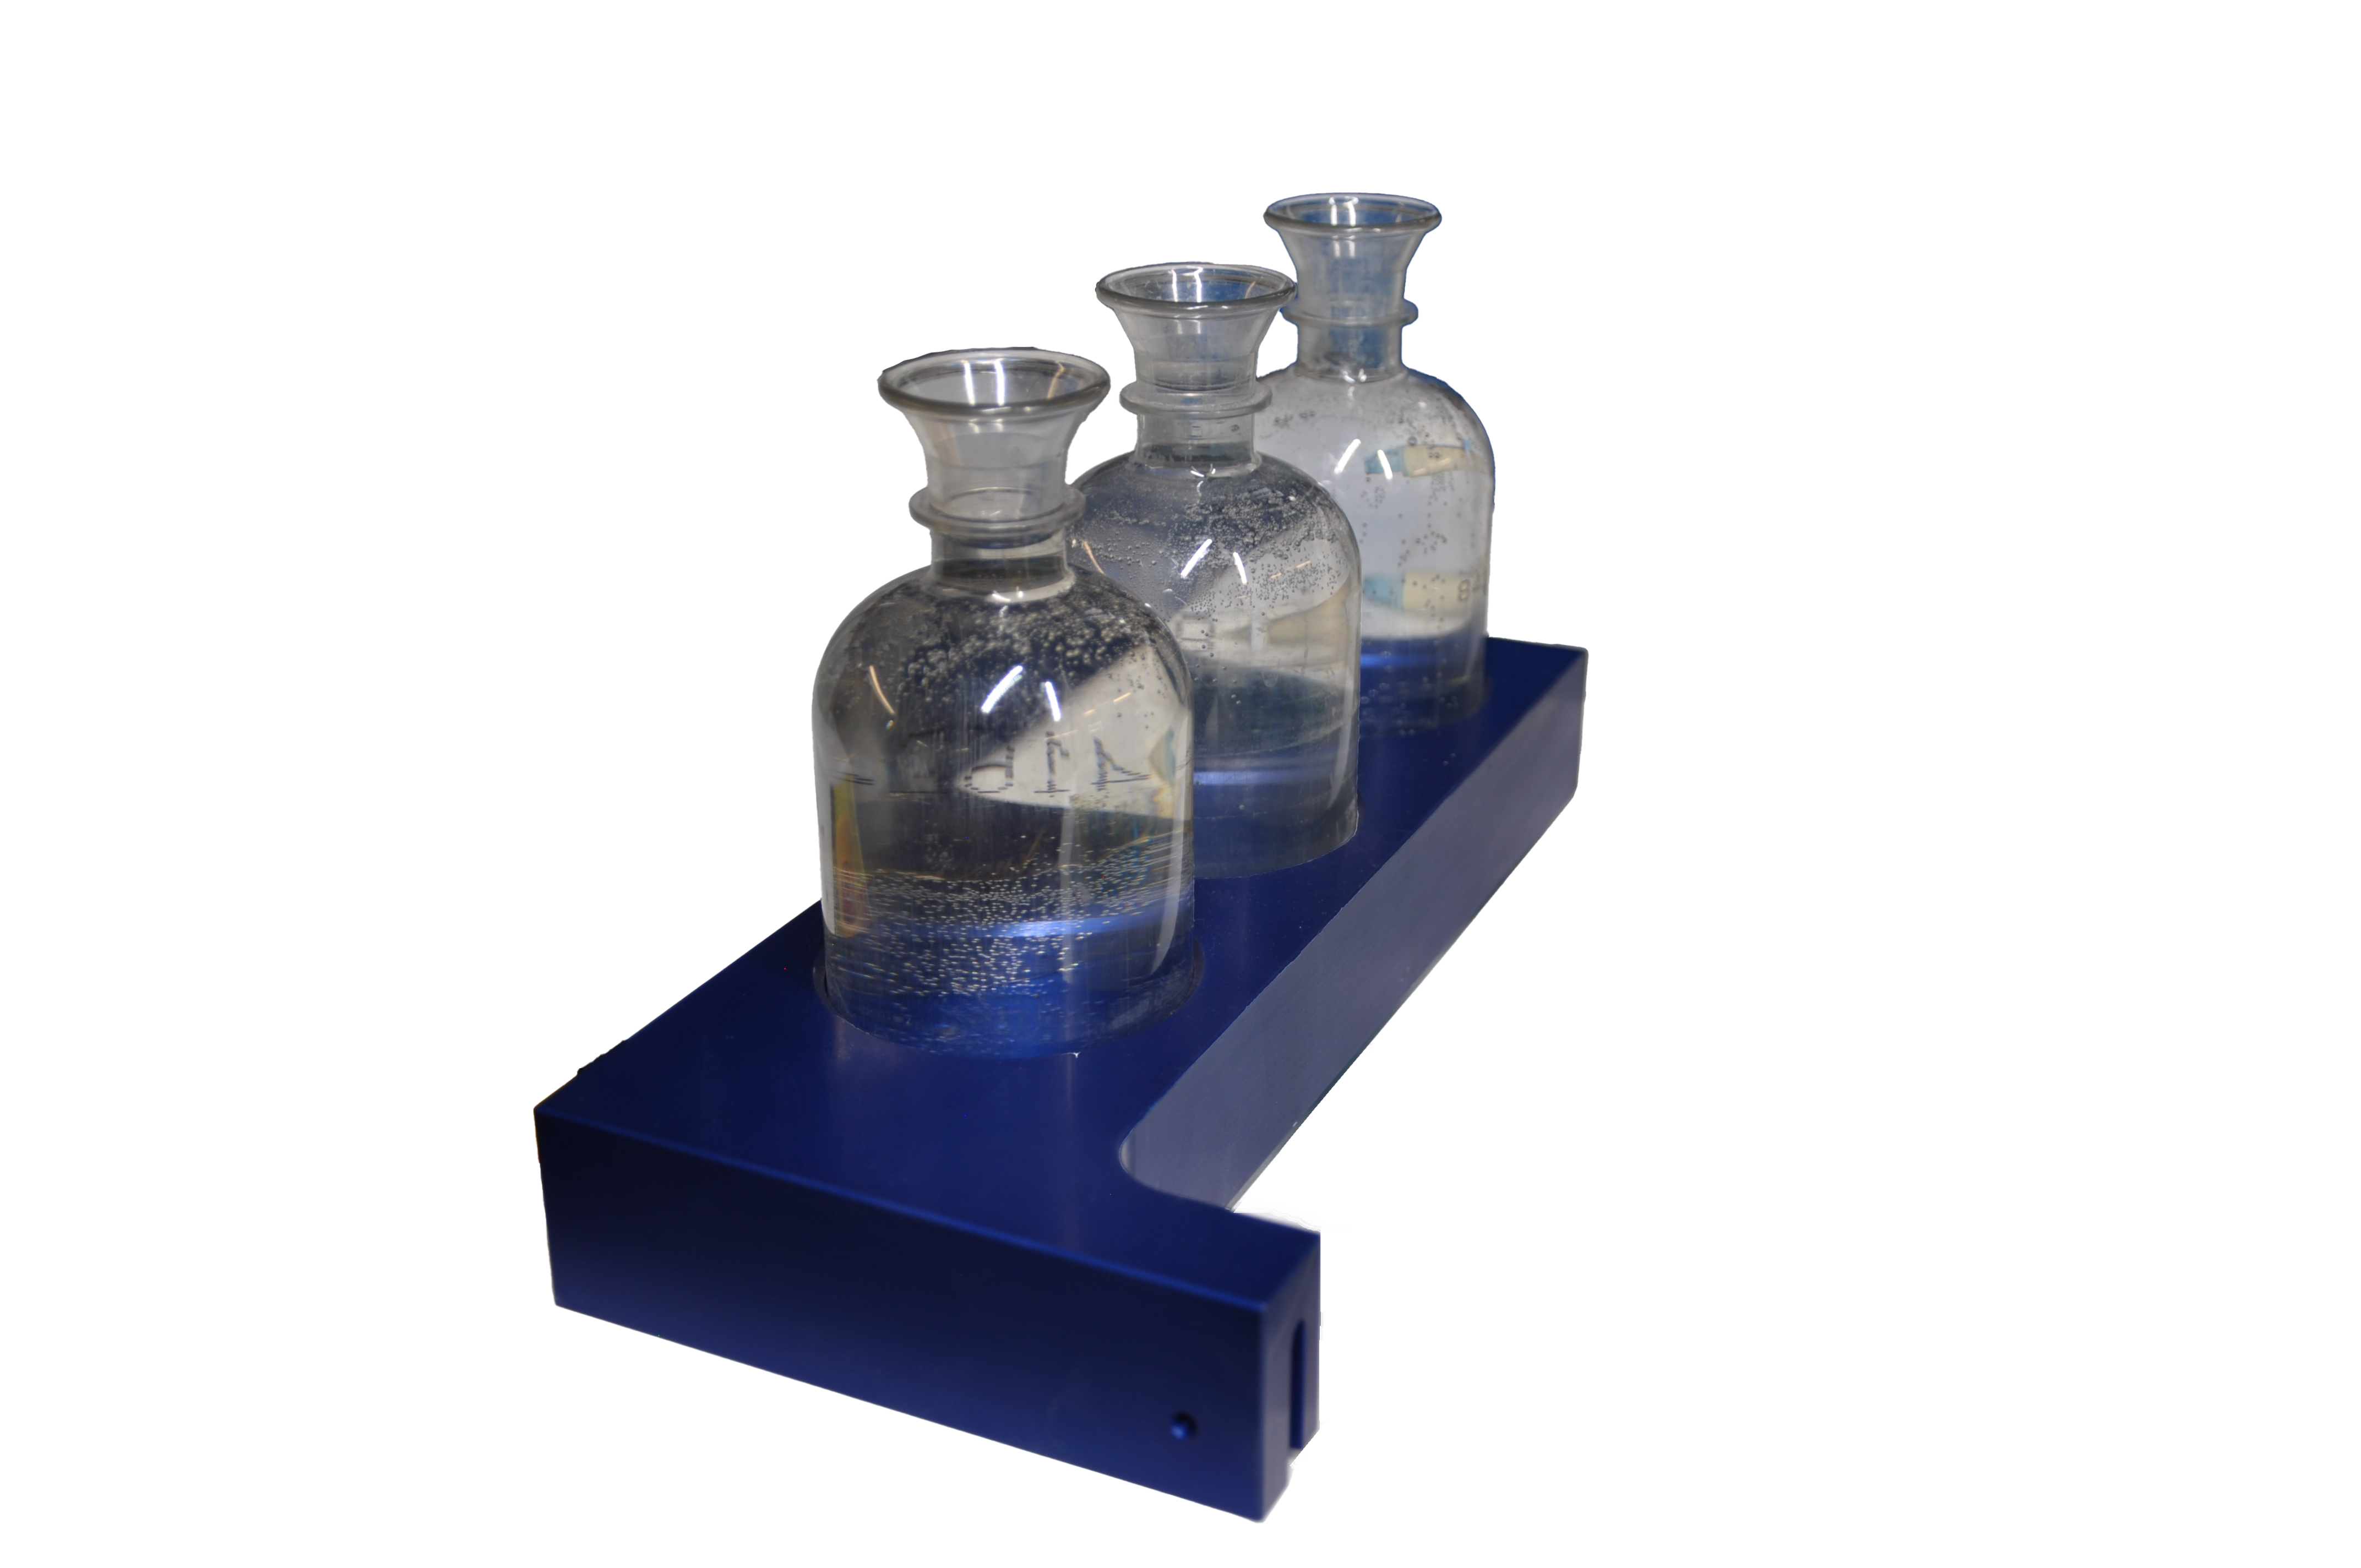
Part Numbers # of Positions Tube/Cup Size Autosampler Model PB-10265 3 300mL All AM400 Models 
- My DO meter isn’t communicating to BOD Pro. Is there a way to reset it?
First, confirm the correct COM port is selected. If this does not work, you will need to the reset the meter’s firmware. For step-by-step instructions, view PDF here.
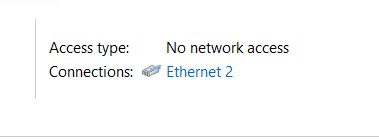
- I'm having troubles connecting my MiniHub. Is there a way to reset it to factory settings?
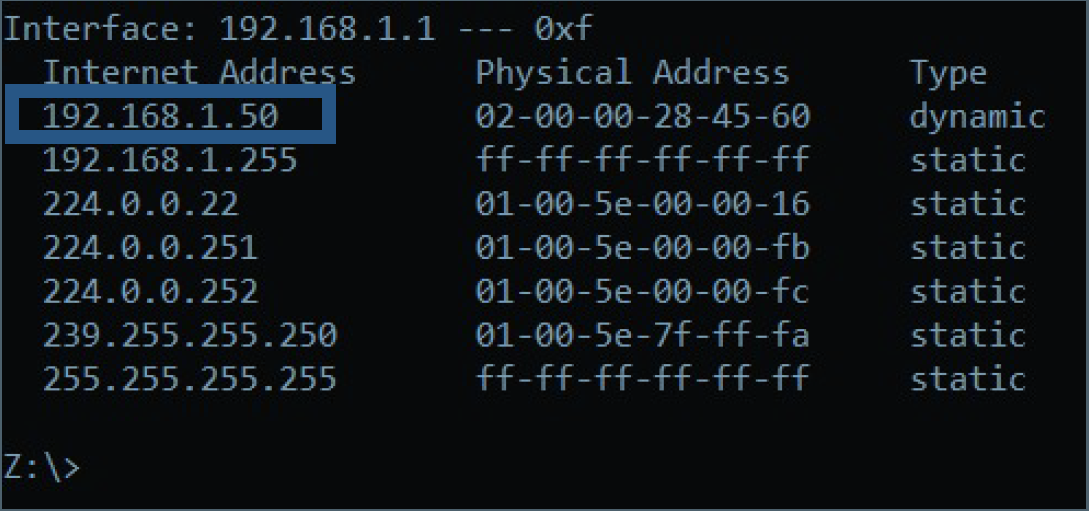
Yes! Follow our short tutorial on resetting your MiniHub to factory settings if it does not connect to the IP address of 192.168.1.10
Follow our updated technical bulletin here.
- What are the part numbers and BOMs for the QC Racks?
Refer to the following table for updated part numbers and BOMs for the QC Racks.
Part Number Description PC-AM400-QC-50-24 Rack for QC or calibration locations using 50ml tubes. Allows for 24 positions. Can be used with all AM400 series autosamplers PC-AM400-QC-50-36 Rack for QC or calibration locations using 50ml tubes. Allows for 36 positions. Can be used with AM402, AM403, AM404, and AM405 autosamplers PC-AM400-QC-50-48 Rack for QC or calibration locations using 50ml tubes. Allows for 48 positions. Can be used with AM403, AM404, and AM405 autosamplers PC-AM400-QC-120-9 Rack for QC or calibration locations using 120ml cups. Allows for 9 positions. Can be used with all AM400 series autosamplers PC-AM400-QC-120-18 Rack for QC or calibration locations using 120ml cups. Allows for 18 positions. Can be used with AM402, AM403, AM404, and AM405 autosamplers PC-AM400-QC-120-27 Rack for QC or calibration locations using 120ml cups. Allows for 27 positions. Can be used with AM403, AM404, and AM405 autosamplers PC-AM400-QC-125-7 Rack for QC or calibration locations using 125ml cups. Allows for 7 positions. Can be used with all AM400 series autosamplers PC-AM400-QC-120-18 Rack for QC or calibration locations using 125ml cups. Allows for 14 positions. Can be used with AM402, AM403, AM404, and AM405 autosamplers PC-AM400-QC-120-27 Rack for QC or calibration locations using 125ml cups. Allows for 21 positions. Can be used with AM403, AM404, and AM405 autosamplers - What languages are supported by BOD Pro?
BOD Pro is now available in several languages! BOD Pro supports the following languages:
- Arabic
- Greek
- English
- Spanish
- French
- Hindi
- Italian
- Japanese
- Korean
- Malay
- Punjabi
- Polish
- Portuguese
- Swedish
- Tamil
- Thai
- Urdu
- What languages are supported by MANTECH Pro?
MANTECH Pro is now available in several languages! MANTECH Pro supports the following languages:
- English (Available Now)
- French (Releasing from v61)*
- Polish (Releasing from v61)*
- Why does my Fluoride method require a Multi-Line calibration?
The Fluoride method requires a multi-line calibration for the probe response at low levels. We have a Minimum Detection Limit for fluoride analysis of 0.01 ppm, and it is known that the slope for fluoride probes (and all ISE probes) deviates from the expected range and approaches zero as the fluoride concentration also approaches zero. We use multi-line to account for this changing slope at the low concentration levels to achieve the lowest detection limit possible. The ability to switch to linear without an effect on results depends on the range you are measuring.
- Why does my Turbidity method require a Multi-Line calibration?
The MANTECH turbidity flow cell has specific optical properties which are different than the cuvettes which you would manually insert (for example the sealed standards for the 3-month calibration). The difference in optical properties between the flow cell cylinder and the cuvette can cause the relationship between actual NTU and expected NTU to be slightly non-linear. This is only applicable in the low end of the measuring range, typically < 1 NTU. To ensure the lowest detection limit possible, we use multi-line to accurately capture how the optical properties of the flow cell are different than the cuvettes.
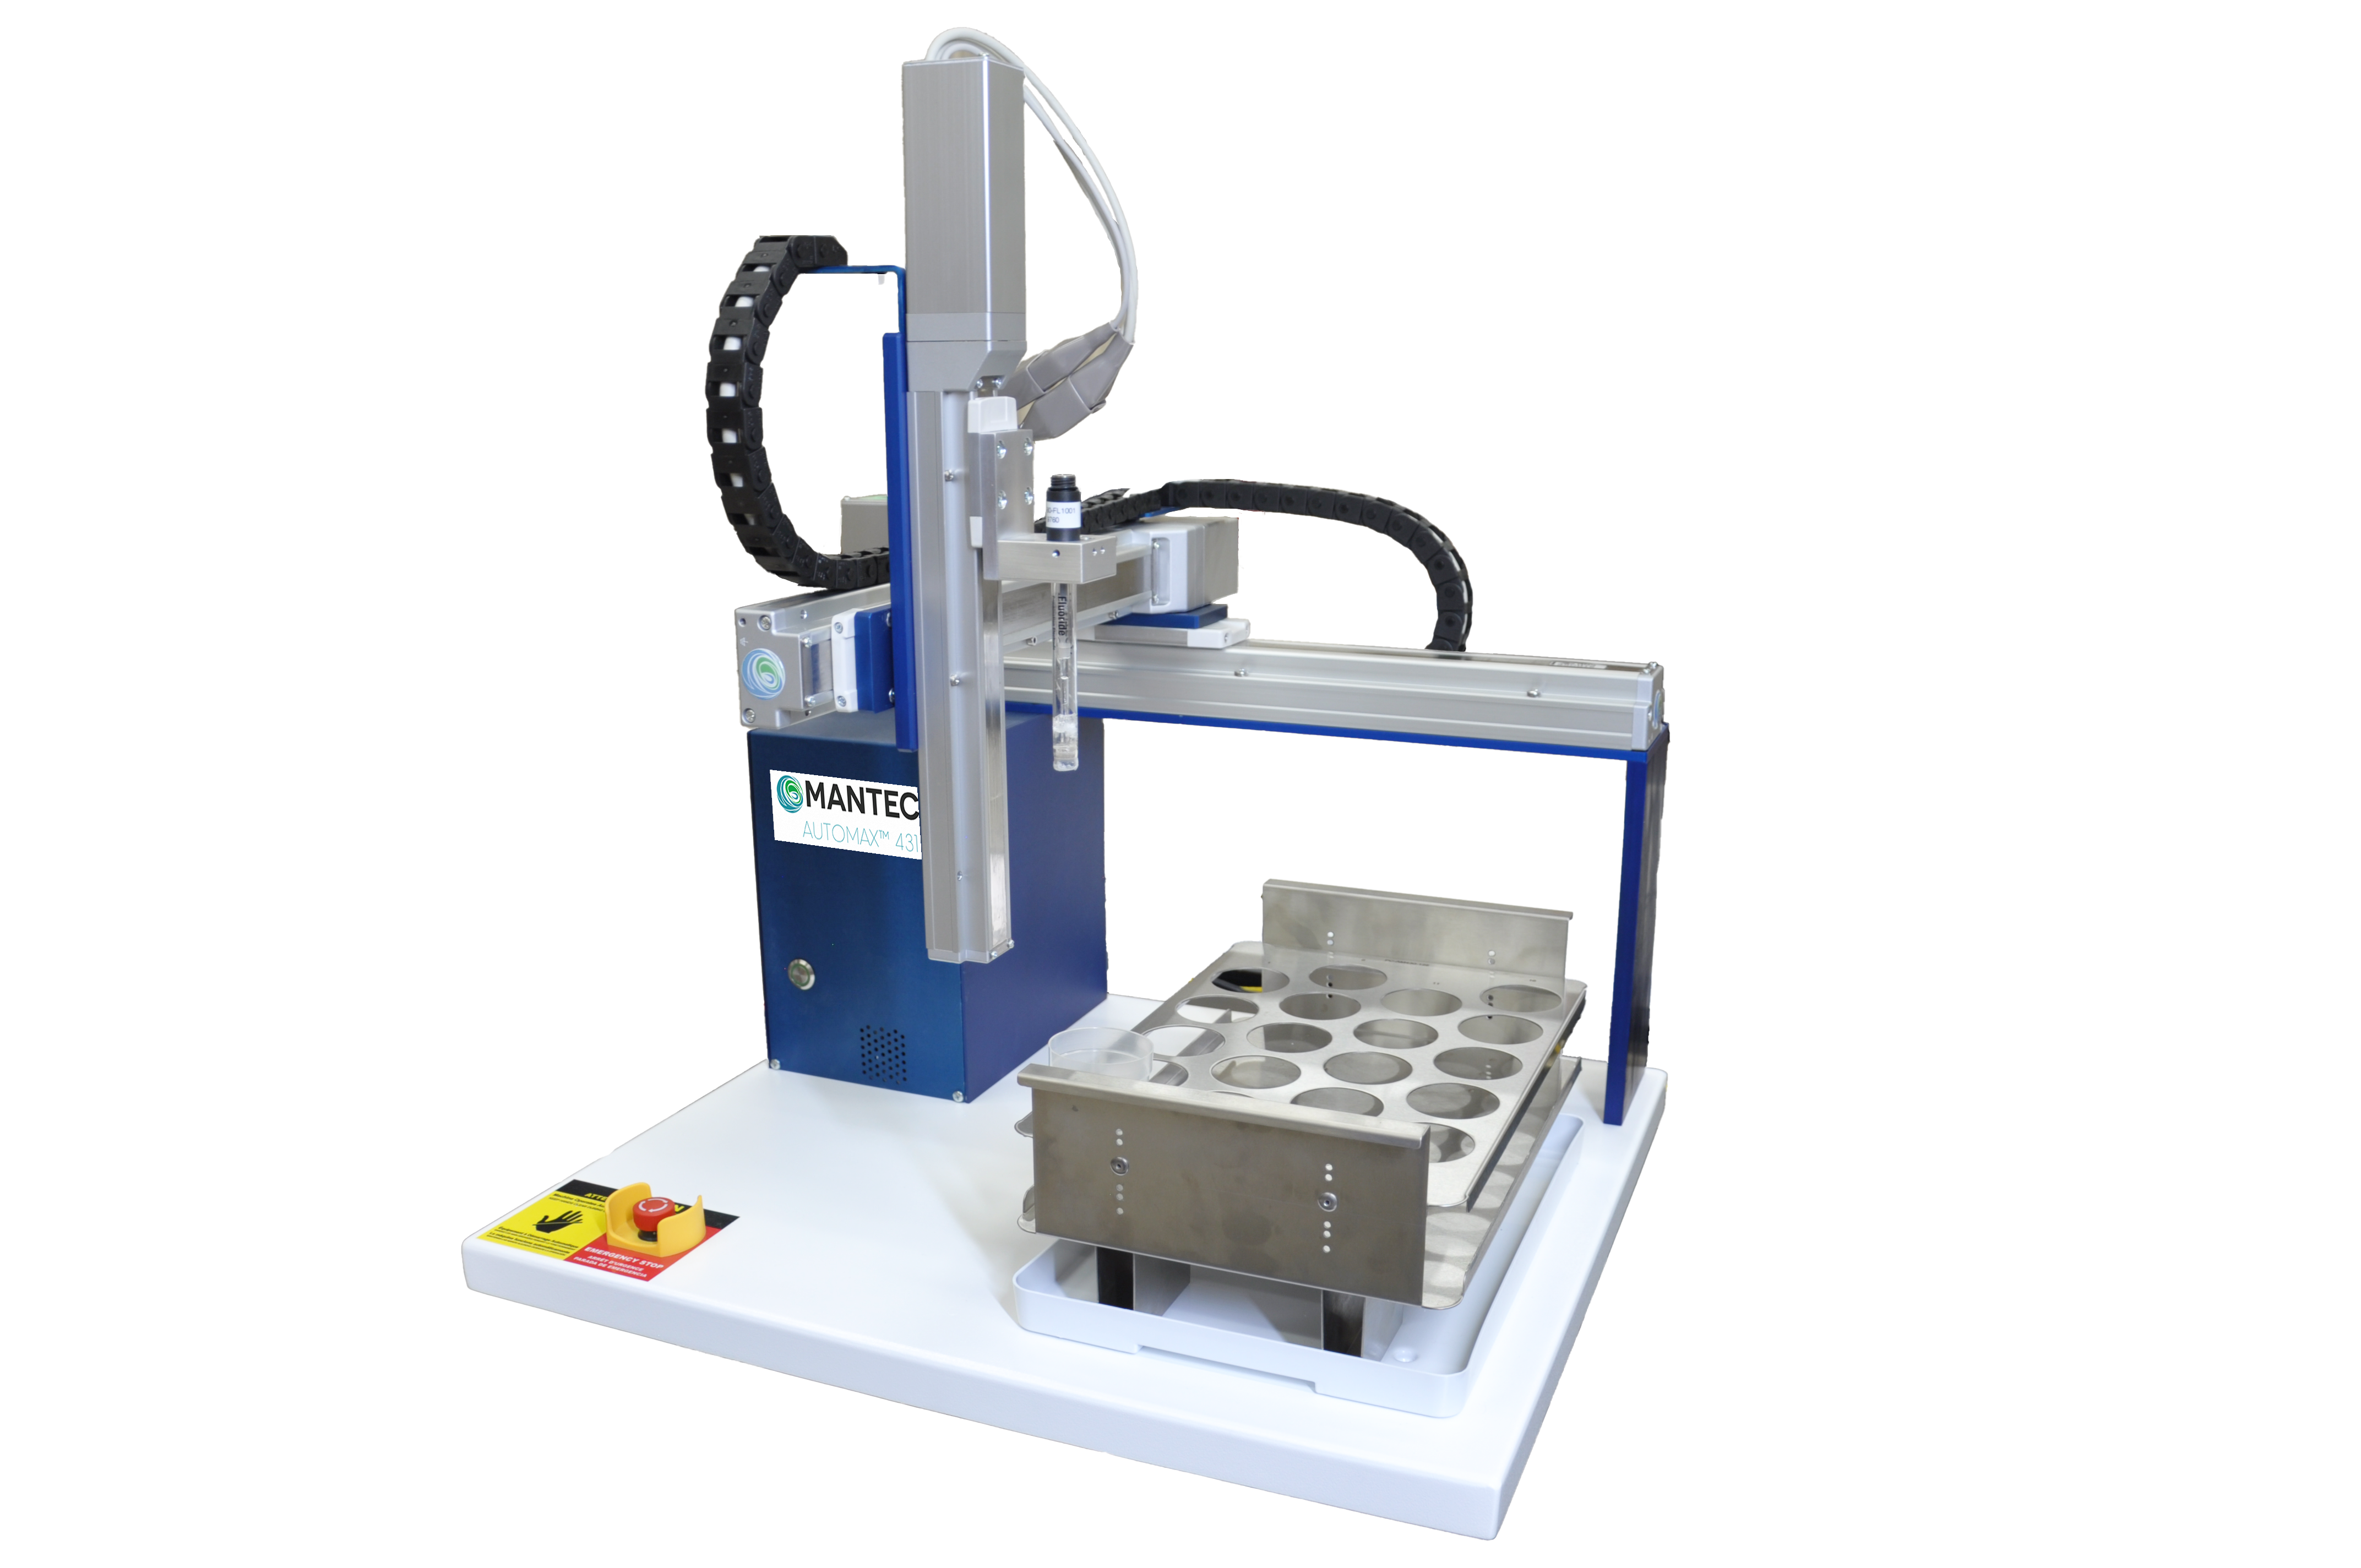
- What are the Dimensions and Space Requirements for MANTECH Systems?
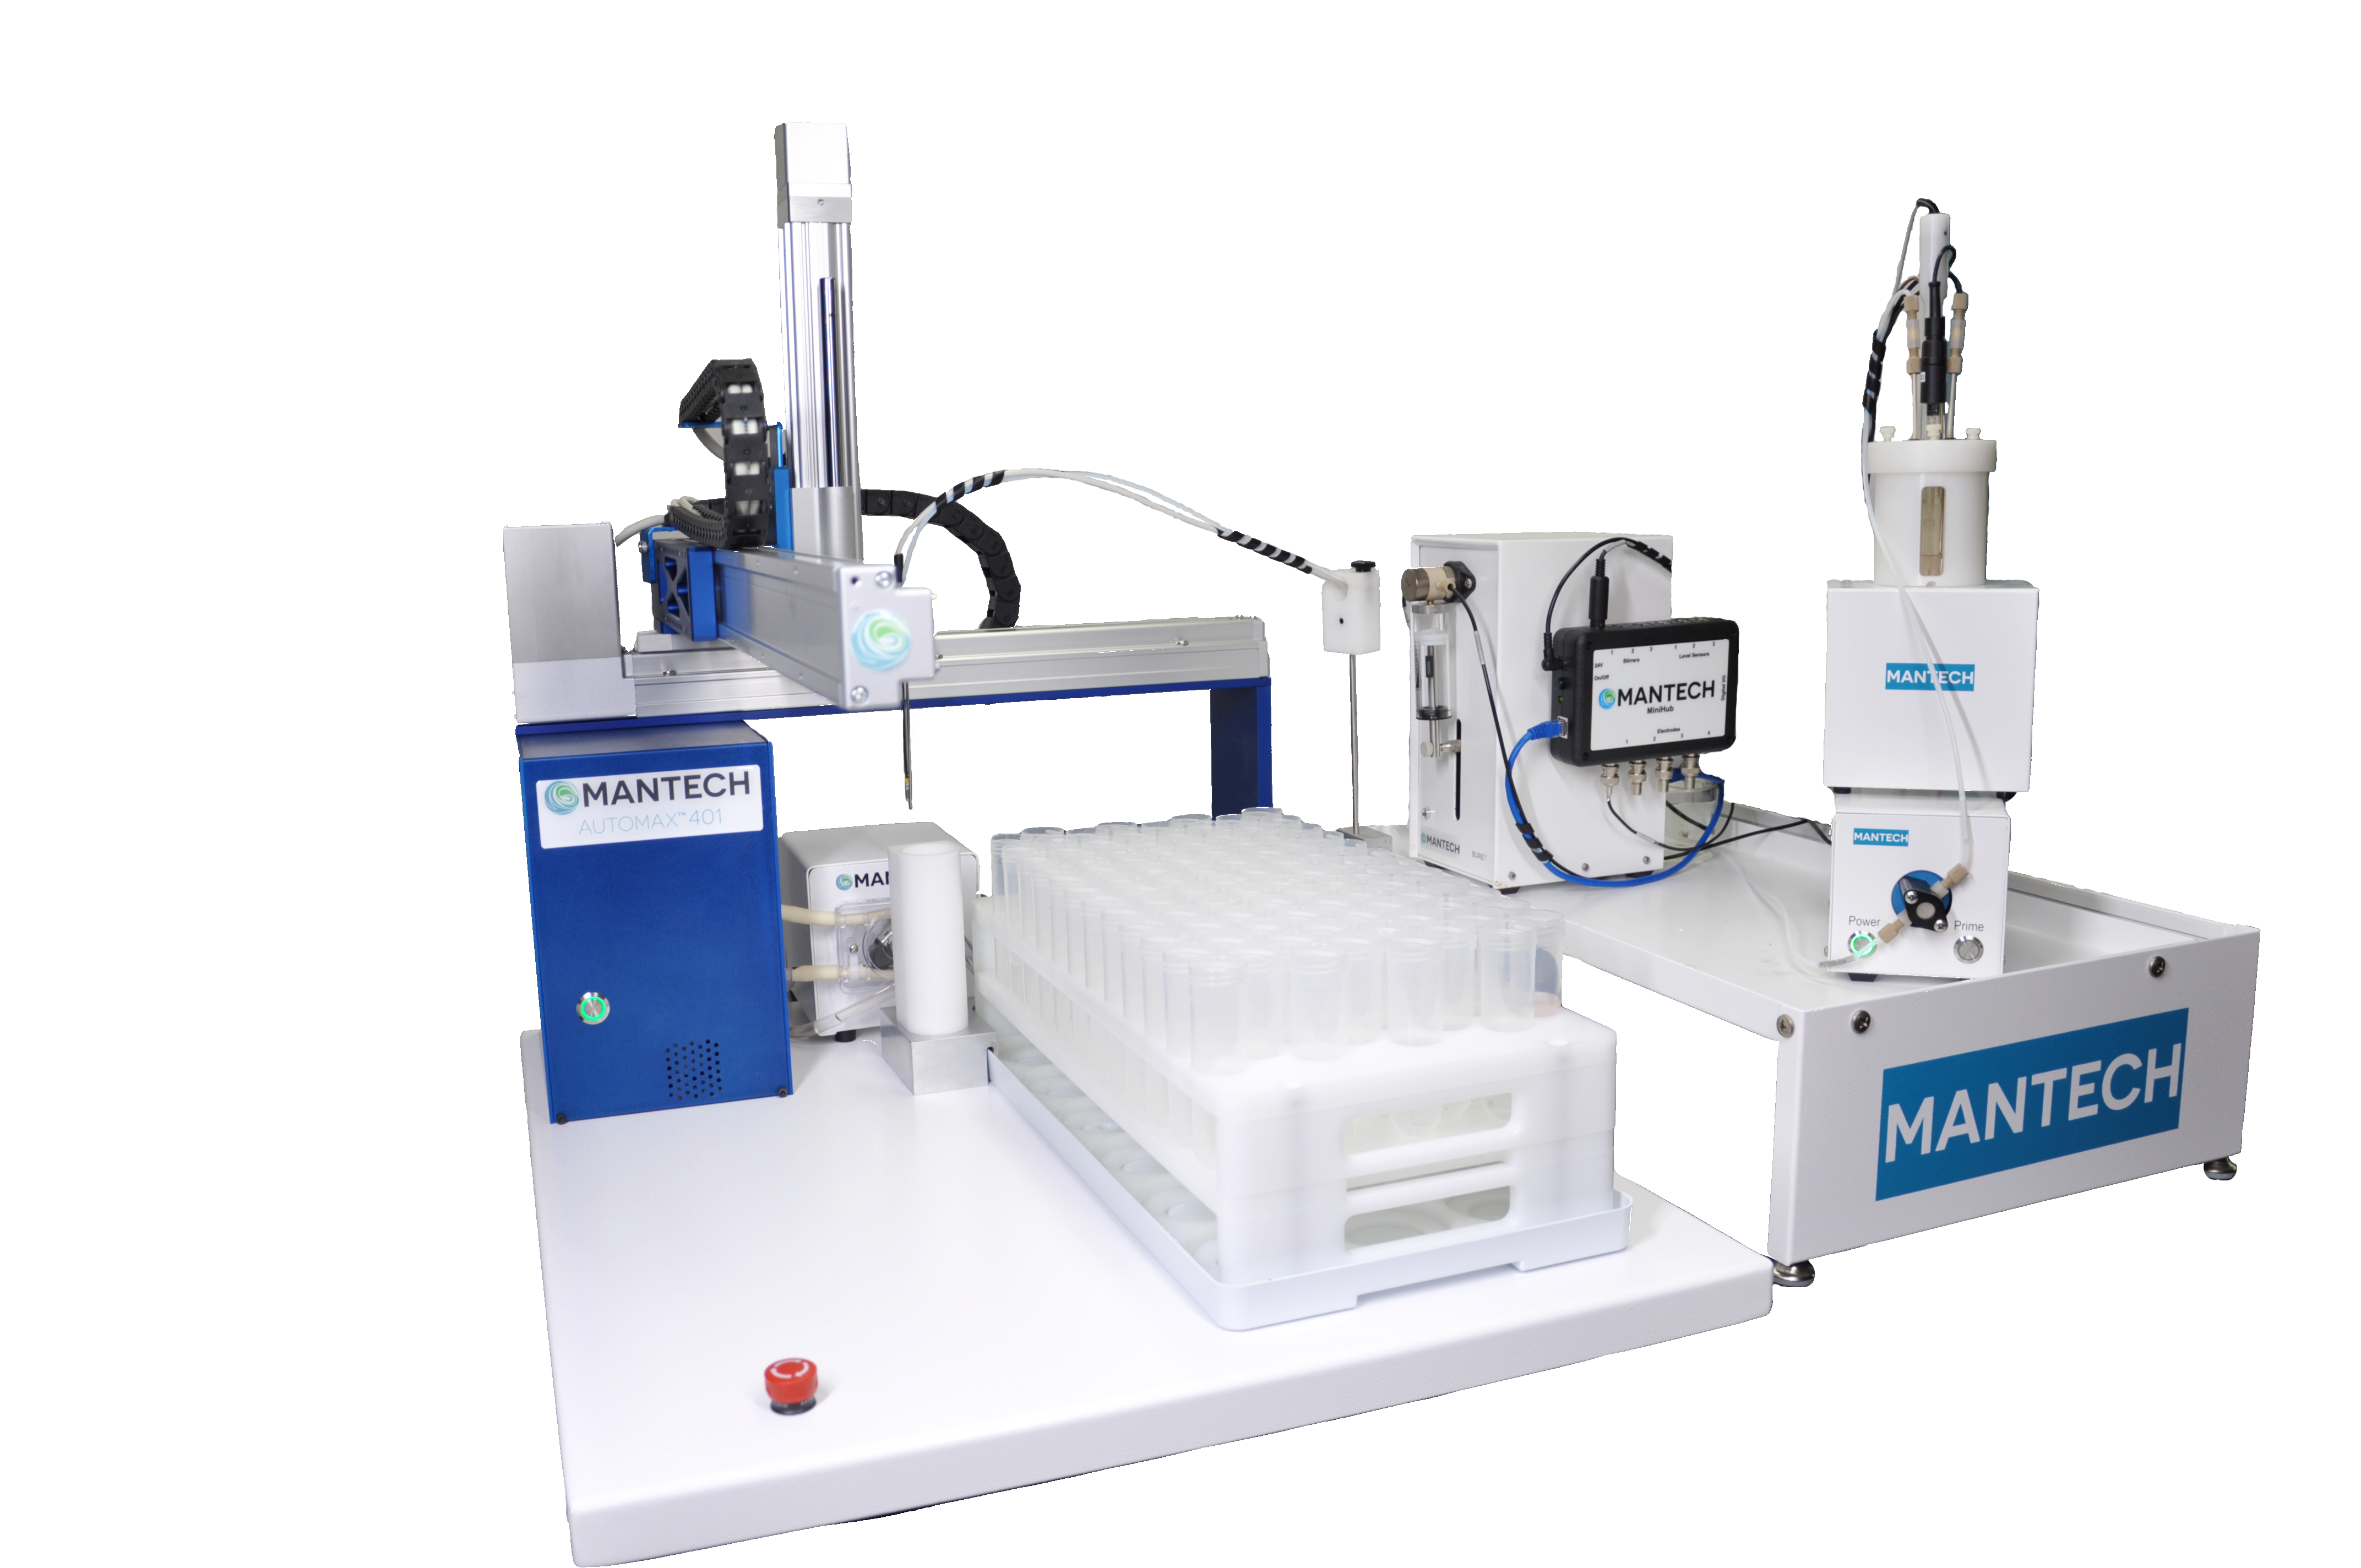
AutoMax400 Series
The AutoMax400 series is available in MANTECH’s MT Series, BOD Pro, and automated PeCOD® systems. The variation for each autosampler in the AutoMax400 series is in the x-direction or width. Note that depth includes space to accommodate power cables.
AutoMax401 AutoMax402 AutoMax403 AutoMax404 AutoMax405 W 24.5” / 62cm 36” / 92cm 48″ / 122cm 60″ / 152cm 72” / 182cm D 32” / 82cm 32” / 82cm 32” /82cm 32” / 82cm 32” / 82cm H 32” / 82cm 32” / 82cm 32” / 82cm 32” / 82cm 32” / 82cm MANTECH System Organizer (MSO) may be required depending on the configuration. Most BOD Pro system do not require a MSO. MANTECH offers two types of MSOs:
- Tall MSO – 17.5” / 44cm x 23.5” / 59cm x 15” / 38cm (H x W x D)
- Short MSO – 6.5” / 17cm x 23.5” / 59cm x 15” / 38cm (H x W x D)
NOTE: System controllers and computer monitors will require additional space and must be within ft. of the system.
AutoMax420 Series

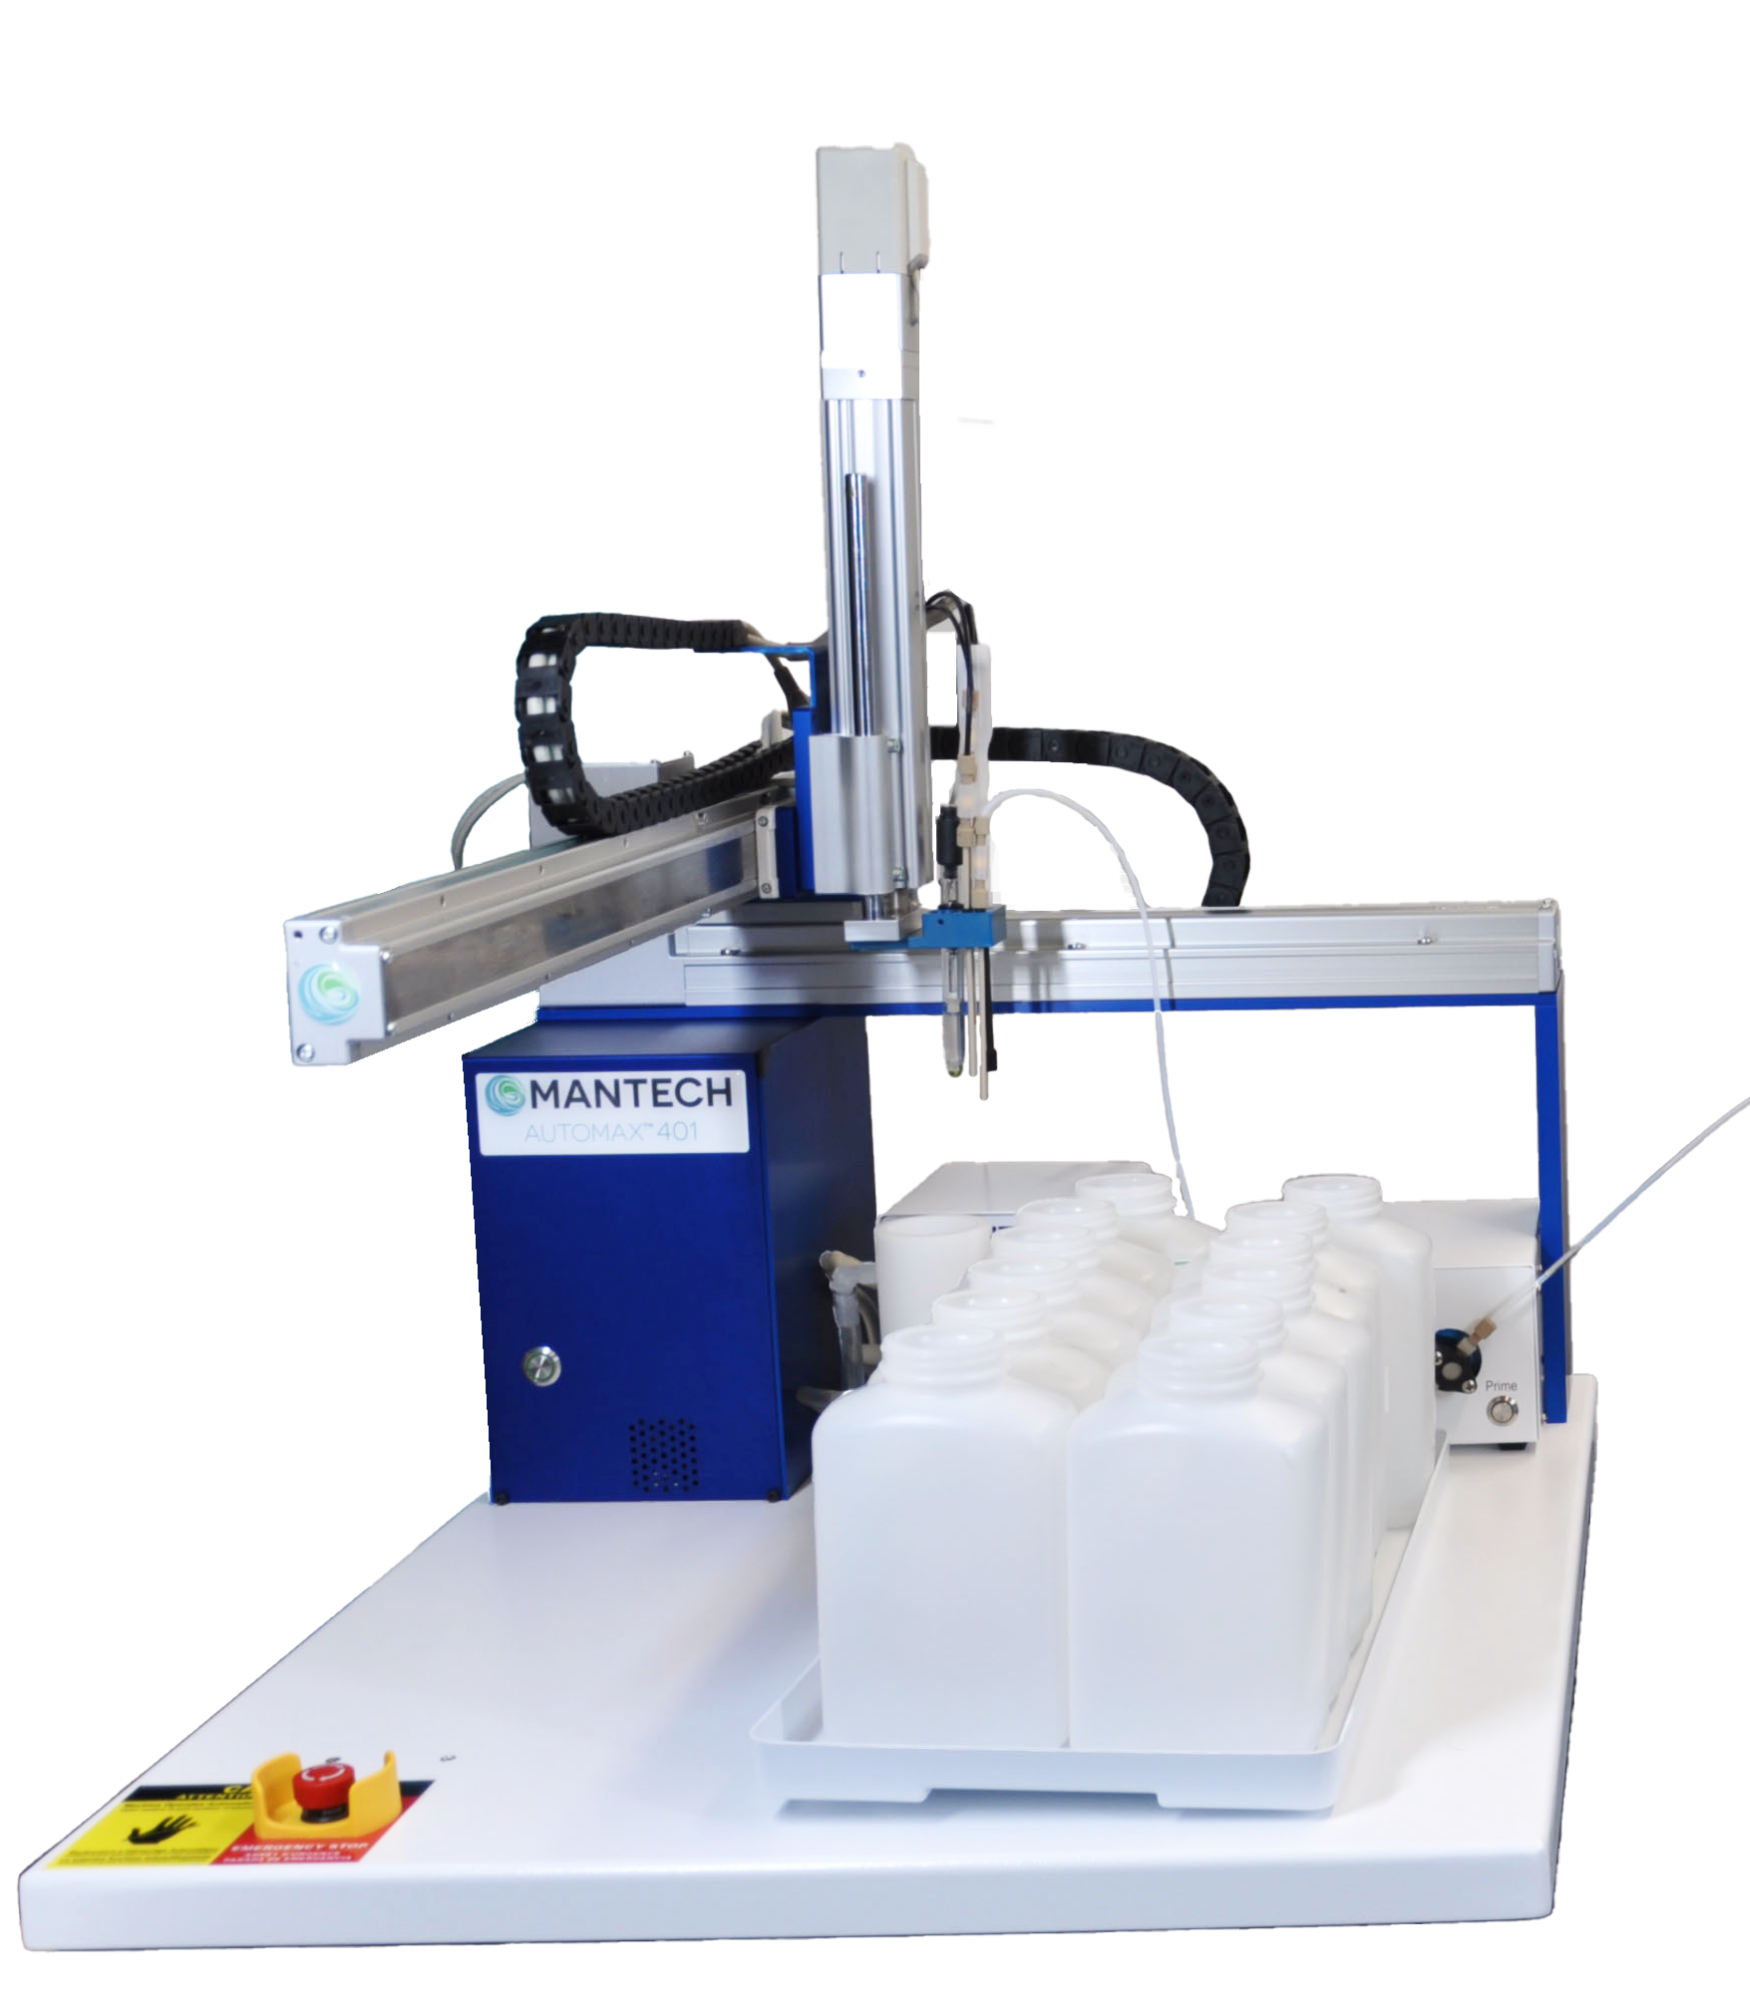
The AutoMax420 series is available for automating sample transfer and/or pH adjustment and measurement for BOD analysis. The AutoMax420 series is coupled with BOD Pro systems. The variation for each autosampler in the AutoMax420 series is in the x-direction or width. Note that depth includes space to accommodate power cables.
AutoMax421 AutoMax422 AutoMax423 AutoMax424 AutoMax425 W 24.5” / 62cm 36” / 92cm 48” / 122cm 60” / 152cm 72” / 182cm D 32” / 82cm 32” / 82cm 32” / 82cm 32” / 82cm 32” / 82cm H 36” / 92cm 36” / 92cm 36” / 92cm 36” / 92cm 36” / 92cm AutoMax430 Series
The AutoMax430 series is available in MANTECH’s MT Series, BOD Pro, and automated PeCOD® systems. The variation for each autosampler in the AutoMax430 series is in the x-direction or width. Note that depth includes space to accommodate power cables.
AutoMax431 AutoMax432 AutoMax433 AutoMax434 AutoMax435 W 24.5” / 62cm 36” / 92cm 48” / 122cm 60” / 152cm 72” / 182cm D 24” / 61cm 24” / 61cm 24” / 61cm 24” / 61cm 24” / 61cm H 32” / 82cm 32” / 82cm 32” / 82cm 32” / 82cm 32” / 82cm MANTECH System Organizer (MSO) may be required depending on the configuration. Most BOD Pro system do not require a MSO. MANTECH offers two types of MSOs:
- Tall MSO – 17.5” / 44cm x 23.5” / 59cm x 15” / 38cm (H x W x D)
- Short MSO – 6.5” / 17cm x 23.5” / 59cm x 15” / 38cm (H x W x D)
NOTE: System controllers and computer monitors will require additional space and must be within ft. of the system.
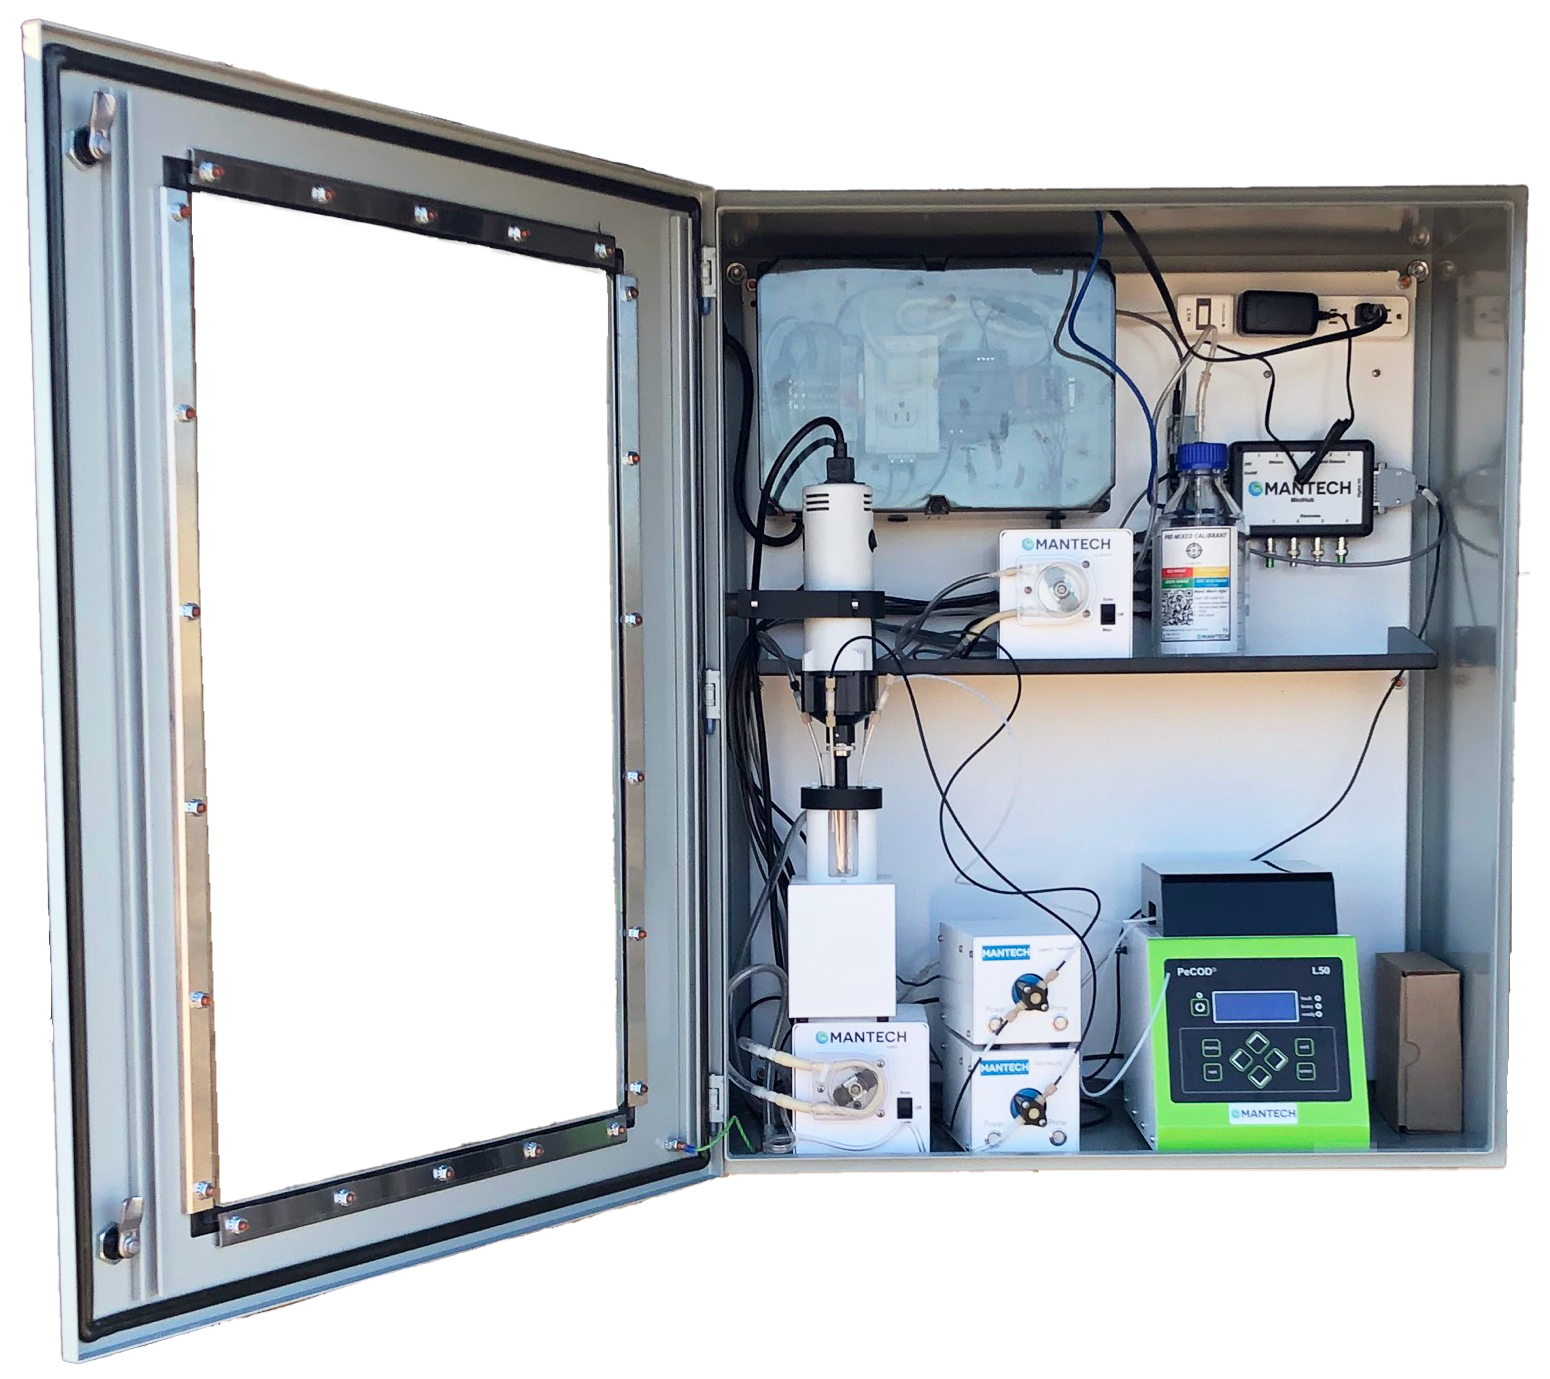
MO1000

The MO1000 series is autonomous online analysis available for PeCOD® and MT Series parameters.
MO1000 Cabinet W 30” / 77cm D 16” / 41cm H 36” / 92cm More than one cabinet may be required depending on the configuration.
NOTE: HMI (Human Machine Interface) will require additional space on top of cabinet.
- I have an existing PC-Titrate. How do I upgrade and install MANTECH Pro?
To upgrade and install MANTECH Pro is simple if you have a PC-Titrate. Once an order is placed, a member from MANTECH’s QC team will contact you for your active hinterland database. Once that information is verified, we will copy the methods to MANTECH Pro and send a USB with the needed adapters for the hardware.
If needed, a member of our team is available to schedule a meeting to ensure that the methods and reports are working to your specific needs.
How to install MANTECH Pro in 4 easy steps:
- Double click on the installer from the USB. Select “Yes” to proceed with the installation. Select “Next” once prompted and unselect “Read Me” once the installation is complete.
- Once the program has been installed, open the %programdata% folder on your computer by searching it in the taskbar. Once that has been opened, use the following pathway to find the folder \MANTECH\MANTECH PRO\Database.
- Add the DB.SQLite file from the USB to the database folder. Add the tray file from your USB to the Tray Files Folder and move the Documents folder from the USB to the MANTECH PRO Folder.
- You will now be able to register your MANTECH Pro software, using the product key and USB.
The best part, PC-Titrate and MANTECH Pro can operate on the same computer with the same hardware minimizing downtime and making the transition easy and risk-free!
- How often do I need to calibrate my Fluorescence sensor?
Frequency of calibration for the Fluorescence sensor is a function of how clean the sensor optical channel is, which is related to the quality of water sample the sensors are exposed to. At a minimum, once per month sensor cleaning followed by a zero calibration using DI Water and a slope calibration using a PTSA-100-FL (100ppb PTSA) / 50ppb Fluorescein ) calibration standard is suggested. If the sensors are exposed to very dirty samples you may need to do this more frequently (ie. Weekly).
Here is a link to a video showing the sensor cleaning process using the cleaning solution and calibration standards: &pp=ygUOcHl4aXMgY2xlYW5pbmc%3D”>&pp=ygUOcHl4aXMgY2xlYW5pbmc%3D
- How to perform a Meter Calibration for Conductivity?
MANTECH Pro automatically performs a single-point calibration without requiring the USER to interact with the meter. A calibration method will not be required. Before running your calibration script, ensure that the meter settings is configured with your probe.
The following steps will outline how to calibrate the meter:
For Automated systems
- Add in your tray file, rinsing, move to tube location and jogging movement steps, prior to the calibration step.
- Add a ‘Timing’ action of 30 seconds. This will allow the meter to stabilize the conductivity reading.
- Add the ‘Conductivity Meter Calibrate’ action and select the conductivity meter configured in Hardware Setup.
- Complete the script, configure the Run Configuration table, and click ‘Go to Run’ to start the meter calibration.
For Manual systems
- Select ‘Misc.’ and type in instructions for analyst to manually dip the probe into the standard solution 3 times.
- Make sure to let the probe rest inside the solution and click ‘OK’ when stabilization icon appears on the Meter.
- Add the ‘Conductivity Meter Calibrate’ action and select the conductivity meter configured in Hardware Setup.
- Complete the script, configure the ‘Run Configuration’ table, and click ‘Go to Run’ to start the meter calibration.
- What are shortcuts?
Shortcuts are customizable buttons that users can create from pre-saved templates generated on Run Configuration table. Shortcuts can have its own unique image and be organized by custom headers.
- What will happen with the data on PC-Titrate? Will it be imported into MANTECH Pro?
PC-Titrate can remain the computer currently operating your system and data can be viewed at anytime. Therefore, your data will not be lost and can be kept on that computer.
Data saved/archived from PC-Titrate will not be able to be transferred onto MANTECH Pro.
Note: To avoid any complications while operating MANTECH Pro, be sure to not use any actions in PC-Titrate that use the Interface, especially during a run on MANTECH Pro.
- Will MANTECH Pro operate the hardware I currently have?
MANTECH Pro will operate most of the hardware you currently have. The following hardware will require an upgrade:
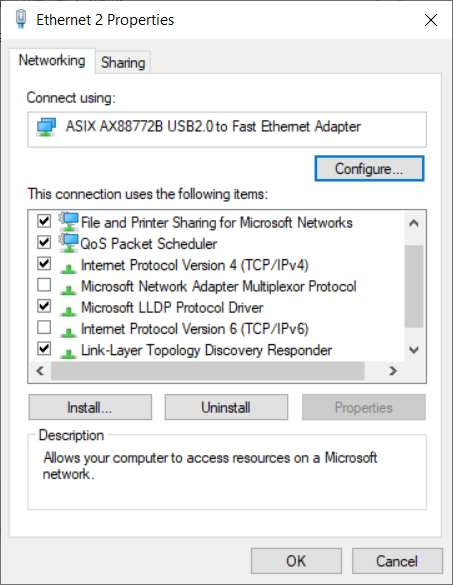
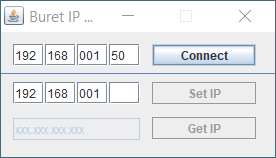
- The old-style Burivar burets will have to be upgraded to our new MANTECH Burets. Burets are operated by an IP address, unique to each Buret, and will require an Ethernet-to-USB adapter we supply (setup will vary by system).
- The old-style Conductivity Meters (4310) will have to upgraded to our 4510 Conductivity Meters. COM port connection is no longer on the Interface but rather through a 1-port or 2-port USB-to-Serial adapter(s) (will vary on system setup).
- The old-style Turbidity Meters (Turbidity AssayPlus) will have to upgraded to our T10 Turbidity Meters.
- Computers Operating System (OS) that is not Windows 10 will not operate MANTECH pro. Minimum computer specifications are listed here.
With the increase in USB connections to the computer, a multi-USB 3.0 hub may also be required.
PDF version for download: Required Hardware Upgrades
- What are the required computer specifications to operate MANTECH Pro?
MANTECH Pro will only operate on Windows 10 and 11 computers.
Click here to view the minimum computer specifications to operate MANTECH Pro
- What is MANTECH Pro?
In October 2020, MANTECH has released new software called MANTECH Pro. MANTECH Pro is a Lab Automation software that is entailed to operate our MT-systems and PeCOD Analyzers with plenty of features that analysts desire.
To learn more about MANTECH Pro, click here for more information.
- Do you offer barcoding options?
Yes, we do offer barcoding options. Barcoded labels will help you quickly identify results. Barcoded options are available and additional hardware is required.
- How will I be notified when there is a new software update?
At MANTECH, we are continuously updating our software and adding new features. You will receive push notifications if you are connected to the network or if you have an internet connection. If you are offline, you will receive a direct email from MANTECH.
- Are your stirrers manual or automatic?
BOD Pro™ Software detects the optimal time to turn on the stirrer while taking DO readings. This feature improves operational efforts for analysts and streamlining your runs.
- What service and support options are available?
MANTECH offers options for on-site or remote assistance. With the customer’s permission, a MANTECH representative can remotely control operations, answers questions, resolve challenges and assist with any other requests. MANTECH offers on-site support with one of our Technical Representatives within 72 hours across Canada and the U.S. Our team of Technical Representatives will assist in installation, repairs, and preventative maintenance of your systems. Find your nearest Technical Representative here. For on-site services outside of Canada and the U.S., please contact your distributor here.
- Is MANTECH Pro compatible with my LIMS system?
Yes. MANTECH Pro is agnostic, and our CSV import/export functionality is easy-to-use and flexible with all LIMS systems. You can find a tutorial on how to import/export your data from your MANTECH Pro Software to your LIMS system or network here.
- What is BOD Pro software?
Following months of BETA testing, in early 2022, MANTECH has released new software called BOD Pro. BOD Pro is a lab automation software that is entailed to operate our automated and manual BOD systems with plenty of features that analysts desire.
- What DO meter is required for BOD Pro?
BOD Pro has been designed to integrate YSI MultiLab DO meters. MANTECH offers single, dual or triple probe options to cut busy laboratory’s run times to a fraction of the time! BOD Pro supports YSI MultiLab 4010-W series including:
- YSI MultiLab 4010-1W
- YSI MultiLab 4010-2W
- YSI MultiLab 4010-3W
A manual data entry option allows customers can use alternative DO meters.
Note: BOD Pro Software does not support the YSI MultiLab 4010-1, 4010-2, and 4010-3 models.
- Is BOD Pro compatible with my LIMS system?
Yes. BOD Pro™ Software is agnostic, and our CSV import/export functionality is easy-to-use and flexible with all LIMS systems.
- What are the computer specifications to operate BOD Pro?
BOD Pro software requires a computer with Windows 10/11 Pro OS with minimum 4GB RAM. View PDF for Minimum Computer Requirements here.
- Will BOD Pro operate with the hardware I currently have?
BOD Pro has been designed for MANTECH’s latest hardware releases. Learn more about our new hardware here.
Hardware trade-in offers are available for existing PC-BOD customers.
- What are shortcuts?
Shortcuts are customizable buttons that users can create from pre-saved templates generated on Run Configuration table. Shortcuts can have its own unique image and be organized by custom headers.
- How much do the PeCOD solutions weigh?
Solution Type Weight (g) 1L Electrolyte (Adv. Blue Range) 1400 g 500mL Electrolyte (Green, Yellow and Red Ranges) 647 g 250mL Calibrant (All Ranges) 312 g 250mL Blank (All Ranges) 314 g 250mL Check Standard (All Ranges) 311 g - What is the HS code for MANTECH systems?
The HS code for MANTECH systems is: 9027.80
- Why is there liquid leaking from my TitraSip system?
The presence of liquid beneath the Titrasip would be related to one of two things:
• Overflow from the vessel
• Leaks from the tubingGenerally speaking, the rinse pump for the Titrasip should be able to pump indefinitely with no risk of overflowing over the top of the glass vessel, and this is because of the top waste line connection. That top waste line should be able to drain liquid at the same rate that the pump delivers the rinse water, but to do this it relies on a clear line with no blockages, running downhill for its full length to the drain or waste container. Often when challenges arise with overflowing, it is due to part of the drain line not running downhill, or running horizontally for too long of a distance. Since it is all gravity-based draining, any place in the line where liquid can settle makes it more difficult for liquid to drain from the vessel. The same thing occurs when growth builds up inside the waste line restricting the flow path.
There is a quick way to test whether overflowing is the source of these challenges:
1. Remove the top lid from the Titrasip vessel (storing the pH electrode in storage solution)
2. Test the drain valve with the front switch and also drain any liquid that was in the vessel before
3. Watching the vessel, use the front switch on the Titrasip to turn on the Rinse pump. Keep your finger on the switch.
4. As the vessel fills, it should reach the top connection and start draining down the waste line. The liquid level may go above the connection for a brief second before the full draining starts, but it should not near the top of the glass vessel.
a. IF it continues filling past the top connection and the liquid reaches the top of the glass vessel, turn off the pump. This would confirm that there is a draining challenge leading to overflows.
b. IF the draining occurs properly, you should see the liquid level reach a stable level at the top connection, and the pump would be able to be left on indefinitely without overflowing. This would confirm there is NOT a draining challenge and it is likely a leak in the tubing. - Why did the PeCOD® solutions change?
The formulations of the electrolyte, calibrant, blank, QC check solutions have not changed. By adding deionized or distilled water on-site vs. prior to shipping we have reduced the size and weight of the shipped bottles by up to 75%. This aims to reduce shipping costs, carbon emissions, and plastic waste which translates to a reduction in your cost per sample and carbon footprint.
- What do the Just Add Water solutions mean for existing PeCOD® customers?
The formulation of the electrolyte, calibrant, blank and QC check solutions has not been altered. The Just Add Water solutions are a concentrate only requiring the addition of deionized or distilled water. MANTECH is offering a special discounted supply kit for existing PeCOD® customers which includes:
- 250mL plastic squeeze bottle
- 1/2 gallon jug, 500mL graduated cylinder
- Funnel
- 4x 1L plastic sample bottles with caps
- 1/4″ Grommet (for 1L bottle caps) for waste and QC Check Standard bottles
- Set of labels for empty bottles (Electrolyte, Calibrant, Blank, QC Check Standard and Waste)
- Straw for bottle top dispenser
Please contact MANTECH to order your supply kit here.
- What is the difference between the previous solutions and the Just Add Water solutions?
The Just Add Water electrolyte, calibrant, blank and QC check solutions contain all solutes typically present in our previous solutions and will only require the addition of the respective amount of water (deionized or distilled). This was done with the aim of reducing shipping costs and carbon emissions through a reduction in the amount of water present in the solution.
- What BOD Incubator Does MANTECH Recommend?
The 5-day Biochemical Oxygen Demand (BOD5) test requires that samples be incubated for a period of 5 days between the initial reading of dissolved oxygen, and the final reading. The environment the samples are incubated in must be strictly controlled at 20°C for the entirety of the 5 days, and the best option for establishing this environment is an incubator. There are a wide variety of incubators available in the market with different dimensions and volumes, accommodating more or less samples depending on a laboratory’s requirements.

MANTECH’s BOD Pro analyzer automates the preparation and analysis of sets of samples for this BOD5 test using a multi-position autosampler along with pumps and other components. MANTECH’s AM400 autosamplers all accommodate 12- position or 18-position racks which the operator places the sample bottles into, then starts the run. After the analysis is complete, the operator applies stoppers and overcaps to the bottles according to the Standard Methods, and the sample bottles are placed in the incubator. For the BOD Pro systems, it is greatly beneficial to keep the bottles in position on the racks and place the full racks in the incubator, to save time and effort for the operators.
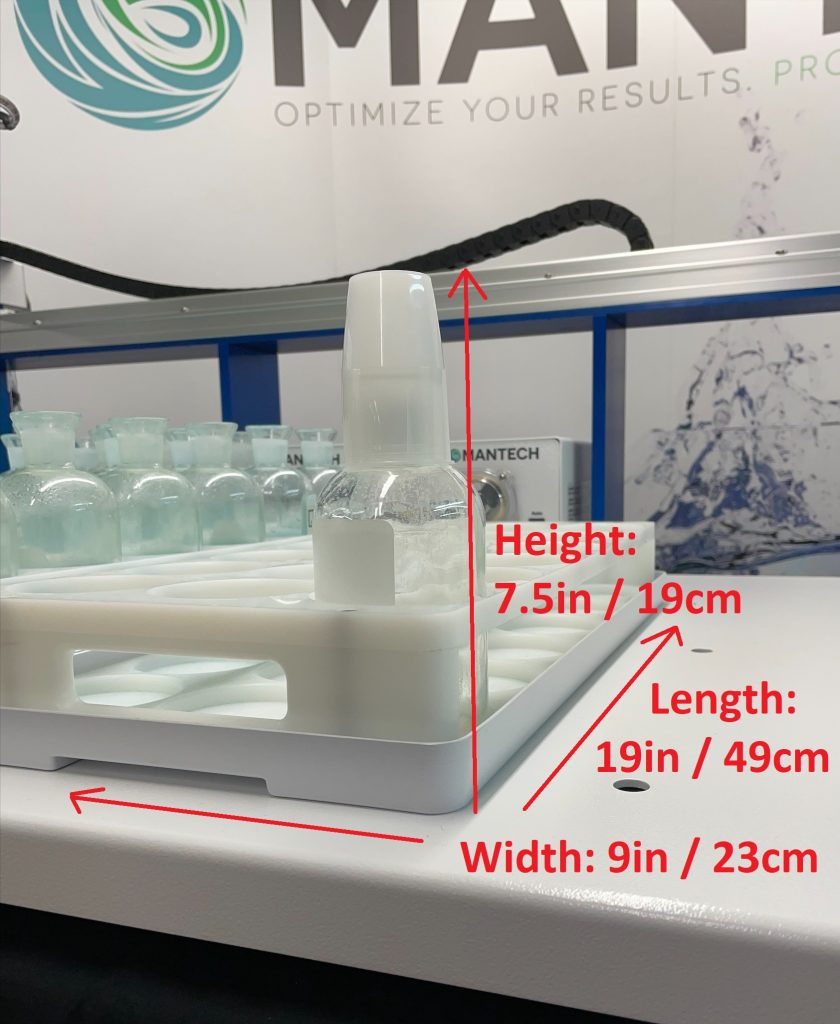
The dimensions of an 18-position BOD rack with bottles, stoppers and overcaps applied are provided below:
L – 19in/49cm
W – 9in/23cm
H – 7.5in/19cm
The dimensions of a 12-position BOD rack with bottles, stoppers and overcaps applied are provided below:
L – 19in/49cm
W – 6in/15cm
H – 7.5in/19cm
When sourcing an incubator for your lab’s BOD analysis, you will want to consider the total number of bottles expected to be analyzed every week, as well as the number of racks those bottles will occupy. For example, if your lab analyzes 200 BOD bottles every week, this would correspond to 12 18-position racks, with the last rack only being partially filled but still taking up the space of a full rack in the incubator.
Some examples of recommended incubator models and their bottle capacities both including racks, and not including racks, are provided below:
Brand Model # Description Capacity with 18-position Racks Capacity with 12-position Racks Capacity w/o Racks Link Fisher Scientific S50441A Economy Standard Incubator, 19.8 L, Aluminum x x 12 https://www.fishersci.ca/ Fisherbrand 15-015-2633 Microbiological Incubator, 60 L, Stainless Steel x x 75 https://www.fishersci.ca/ Fisherbrand 15-015-2634 Microbiological Incubator, 117 L, Stainless Steel x x 108 https://www.fishersci.ca/ Fisherbrand 15-015-2645 Microbiological Incubator, 180 L, Stainless Steel 108 108 144 https://www.fishersci.ca/ Fisherbrand 15-103-1569 Isotemp™ 400 Refrigerated Incubator, 381 L, Stainless Steel 252 252 343 https://www.fishersci.ca/ Fisherbrand 3720A Isotemp™ BOD Refrigerated Incubator, 566 L, Porcelain Steel 288 384 441 https://www.fishersci.ca/ Thermo Scientific 13-262-340 Forma™ Environmental Chamber Model 3920, 821.2 L, Stainless Steel 432 576 792 https://www.fishersci.ca/ - What is the shelf life of MANTECH Turbidity Standards?
MANTECH Turbidity Standards have a one year shelf life from the date they are put in stock. The Expiry Date is always shown along with the lot number on the bottle labels.
- What are the specifications of the external battery pack for the L50?
Type of Battery: Rechargeable NiMH battery
Battery Voltage: 12V
Battery Capacity: 3.8 Ah
Battery Life: Entire day of typical PeCOD use
Charging Time: Approximately 9.5 hours
For more information about the L50 battery packs, please see the manual here.
- What is the flow rate of the IntelliPump?
The MANTECH IntelliPump is a variable speed intelligent pump that is controlled in speed and direction by the MANTECH Pro software. The pump is set at a specific speed (1-100) and either 1/4″ or 1/8″ diameter tubing is used to achieve desired flow rates for various applications. The pump can then be calibrated by measuring liquid dispensed over a set period of time, and entering the value into the Hardware Configuration window of the software.
Pumps are assigned a default estimated flow rate based on the speed setting and tubing size, and this flow rate is used unless the end user decides to run a pump calibration. The estimated flow rates for various speed and tubing settings are provided below:
Tubing Diameter (inches) Speed Setting (%) Flow Rate (mL/min) 1/8” 6 (min) 1.9 10 17.88 20 56.22 30 92.27 40 126.02 50 157.47 60 186.63 70 213.49 80 239.05 90 260.32 98 (max) 276.48 1/4” 3 (min) 2.79 10 61.82 20 146.15 30 230.48 40 314.81 50 399.14 60 483.47 70 567.80 80 652.13 90 736.46 99 (max) 812.36 - What items are required for each PeCOD configuration (benchtop, automated, or online)?
Based on the PeCOD model (benchtop, automated, or online), each system configuration will differ. To view the items required for each model, click here.
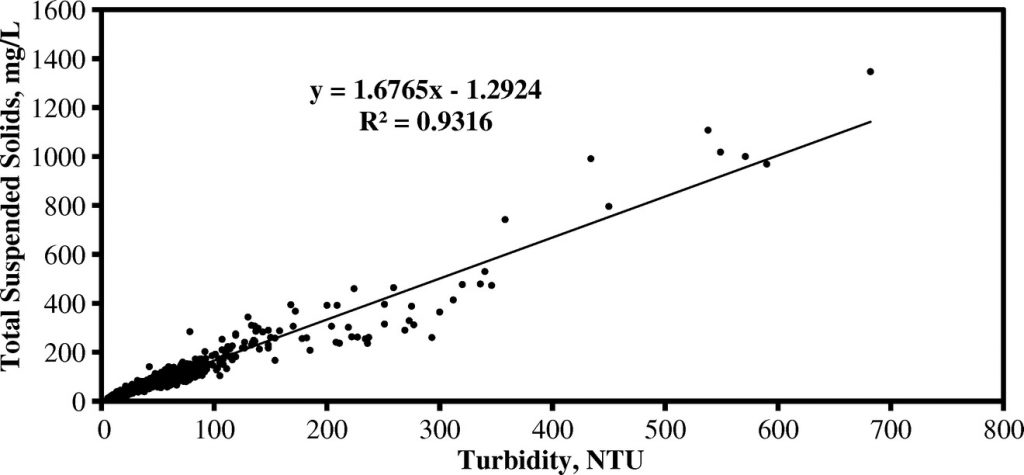
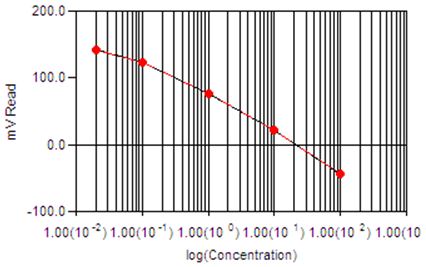
- How do you calculate Total Suspended Solids (TSS) from Turbidity?
Total suspended solids (TSS) is an analysis method that requires filter, wet weighing, drying in an oven for a few hours, then dry weighing. This is typically not performed by treatment plants and even for labs it is time consuming.
Turbidity is a surrogate measure for TSS that allows rapid automated analysis of batches of samples. A log-linear model shows strong positive correlation between TSS and turbidity (R2=0.9374) with a regression equation of [ln (TSS)=0.979 ln (Turb.) +0.574]. This model can be applied directly to turbidity analysis results to determine the TSS. MANTECH offers the MT30 analyzer for quick and easy “hands off” TSS analysis, only requiring 40mL of sample volume in batches up to hundreds of samples.
An example scatterplot showing a Turbidity:TSS correlation is provided below:

- What is ppm (mg/L) of chloride for different conductivity standards?
KCI -> K + Cl
uS mg/L KCL g/L KCl M KCL Cl- ppm 10 5.272469922 0.005272 7.07227E-05 2.507332215 100 52.72469922 0.052725 0.000707227 25.07332215 147 77.50530786 0.077505 0.001039624 36.85778356 1,143 745 0.745 0.009993119 354.286042 12,000 6326.963907 6.326964 0.084867251 3008.798658 - What is the weight and dimensions for AM400 autosamplers?
Autosampler Model Dimensions in Inches Dimensions in Centimeters Crate ONLY (in lbs) Crate ONLY (in kg) Weight Estimates with System & Accessories (in lbs)* Weight Estimates with System & Accessories (in kg)* 401 24 x 33 x 29 62 x 85 x 74 75 34 200 91 402 36 x 33 x 29 91 x 85 x 74 91 41 250 113 403 47 x 33 x 29 122 x 85 x 74 107 49 275 125 404 59 x 33 x 29 151 x 85 x 74 118 54 300 136 405 71 x 33 x 29 183 x 85 x 74 130 59 325 148 *Actual weight may vary by actual system and accessories.
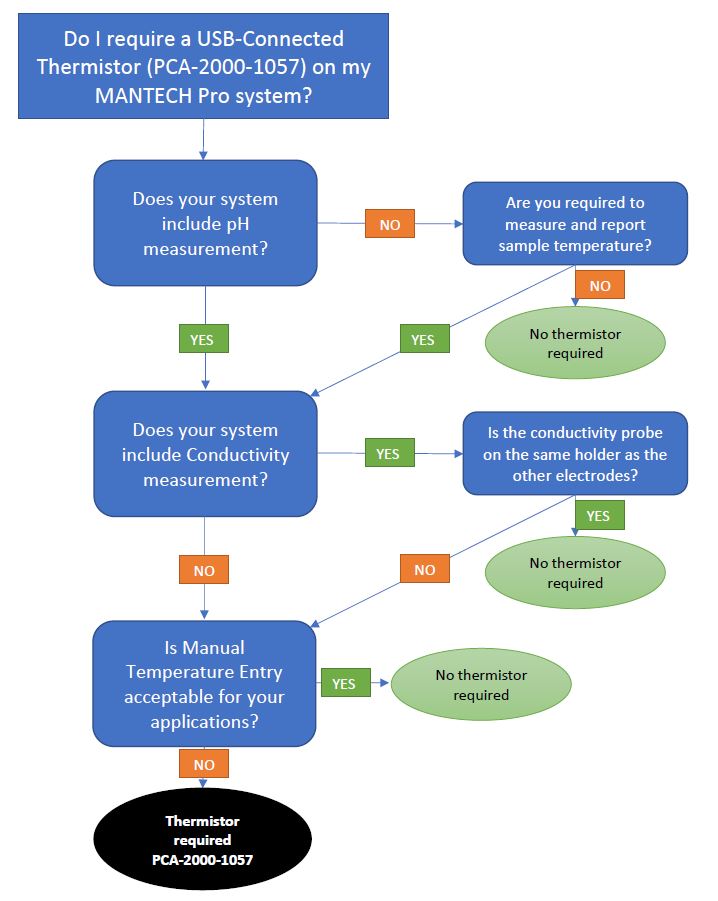
- Do I require a USB-connected Thermistor for Temperature Compensation on my MANTECH Pro system?

- How can I determine true color or filtered color using a turbidity measurement instead of filtering the sample?
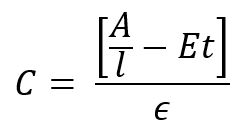
True or Filtered Color is determined by filtering samples through a 0.45 micron filter before analyzing the sample in a spectrophotometer. When running large amounts of samples on automated systems, this filtering can become time consuming and heavy on resource usage. An alternative method (Bennett and Drikas 1993) for determining true color without filtering has been established, through the use of a turbidity meter to quantify the contribution from solids present in the sample. MANTECH can easily combine automated Turbidity and Color analysis on one system, determined from one sample, to provide True Color results without the need to filter.
The determination is as follows:

C – Color result (Cu)
A – sample absorbance (Abs)
l – cell path length (cm)
E – scattering coefficient estimated at 0.00264 NTU-1 cm-1
t – turbidity (NTU)
ϵ – color absorptivity coefficient determined through calibration (Cu-1 cm-1)
- How do I edit the passing criteria for a QC Regime in MANTECH Pro?
For a video tutorial on changing the passing criteria for a QC regime in MANTECH Pro, click here.
- How do I edit PeCOD Parameters in MANTECH Pro?
For a video tutorial on changing PeCOD Parameters in MANTECH Pro, click here.
- What is a QC Check in the PeCOD calibration?
When calibrating the PeCOD, the final step of the QC regime is to complete a QC Check on the pre-mixed calibrant solution. This will analyze the COD value of the pre-mixed calibrant solution to confirm the accuracy of the calibration.
- What is MANTECH's recommended passing criteria for the M value, C value, and I term when calibrating?
MANTECH’s recommended passing criteria varies for each colour range. The image below outlines the recommended criteria for each range.

- What is the acceptance range for MANTECH's pre-mixed secondary standards?
The acceptable range for MANTECH’s pre-mixed secondary standards is ±20%.
- How many cables and what kind are required to connect and MT30 system to the computer?
MANTECH Pro Software requires at least 4 USB cables on the computer. This is not including the computer’s mouse or keyboard. When required, the system will include a 4-port USB hub. Please see Technical Bulletin 2023-012 for a complete list of the minimum computer requirements.
- How do you calculate seed correction and BOD?
To learn how to calculate Seed Correction and BOD, please refer to this document. In BOD Pro, two separate values for Seed Correction Factor are stored along with the Run; one is referred to as BODSeedCorrection, and the other CBODSeedCorrection. The way we calculated BODSeedCorrection in BOD Pro is as follows:
- Dividing the depletion of each BOD Seed bottle by its own volume (the seed volume), the resulting quantity is referred to as DepletionPerMLSeed
- and then we average the DepletionPerMLSeed over all the BOD Seed bottles.
CBOD Seed Correction was calculated by doing the same on CBOD Seed bottles. The software allows for only one Seed ID to be included in the Run. There can be any number of BOD or CBOD Seed bottles within that Seed ID group.
- What does high BOD indicate?
BOD indicates the amount of putrescible organic matter present in water. Therefore, a low BOD is an indicator of good quality water, while a high BOD indicates polluted water. Dissolved oxygen (DO) is consumed by bacteria when large amounts of organic matter from sewage or other discharges are present in the water.
- What happens if COD is high?
Higher COD levels mean a greater amount of oxidizable organic material in the sample, which will reduce dissolved oxygen (DO) levels. A reduction in DO can lead to anaerobic conditions, which is deleterious to higher aquatic life forms.
- What causes high COD in wastewater?
COD increases as the concentration of organic material increases. It also increases if inorganic compounds susceptible to oxidation by the oxidant (typically dichromate) are present. Water with high COD typically contains high levels of decaying plant matter, human waste, or industrial effluent.
- What is the BOD of raw sewage?
BOD can also be defined as the amount of oxygen required by the micro-organisms in the stabilization of organic matter. The results are generally expressed as the amount of oxygen taken by one litre sample (diluted with aerated water) when incubated at 20 degree for five days. BOD of raw sewage is 300-600 mg/litre.
- What is the COD BOD ratio in domestic sewage influent?
BMS have recorded average ratios of 2-3 mg/l COD to 1 mg/l BOD over its 30 years of business. Influent COD in normal domestic sewage is therefore generally 600 – 900 mg/l and it is then treated to at least 30 -100 mg/l before discharge to minimize pollution potential.
- Why is COD higher than BOD?
COD is normally higher than BOD because more organic compounds can be chemically oxidized than biologically oxidized. This includes chemicals toxic to biological life, which can make COD tests very useful when testing industrial sewage as they will not be captured by BOD testing.
- What does it mean if I want to upgrade from PC-Titrate to MANTECH Pro?
To ensure a seamless transition for all end-users, PC-Titrate and MANTECH Pro™ can run simultaneously from the same computer. Also, MANTECH Pro™ has backward compatibility and will operate with most existing hardware. Check here to see if you’ll require an upgrade. *Trade-in offers available for older burets.
- Does PeCOD® require filter or homogenizer for samples with large particles?
For samples containing particles larger than 50μm, a pre-filtration or homogenization step is required. For biochemical oxygen demand (BOD) analysis, a simple pre-filtration step is required. For chemical oxygen demand (COD) analysis, no filtering required as we recommend a homogenizer that gets all particles to a 1micron size. We use the below:
PRO200 Homogenizer with SS Probe – This is our base model and setup can be used within 5ml-50ml tubes with sample piece size of 10mm or less or liquid base sample up to 100ml. (MANTECH part number: PCH-4000-197)
PRO250 Homogenizer with SS Probe – When there is a more viscous/thick or larger solid sample piece over 10mm, our 20mm X 115mm SS Probe would be needed. This homogenizer & probe setup can cover 50ml-500ml tubes/beakers. Other probes can be used with this Homogenizer for even larger volumes. (MANTECH part number: PCH-4000-198)
Homogenization can be automated using the autosampler arm and in our online analyzer.
- What is chemical oxygen demand?
Chemical Oxygen Demand (COD) analysis is a measurement of the oxygen-depletion capacity of a water sample contaminated with organic waste matter. Specifically, it measures the equivalent amount of oxygen required to chemically oxidize organic compounds in water. COD is used as a general indicator of water quality and is an integral part of all water quality management programs. Additionally, COD is often used to estimate BOD (Biochemical Oxygen Demand) as a strong correlation exists between COD and BOD, however COD is a much faster, more accurate test. Learn more here.
- What is biochemical oxygen demand?
Biochemical Oxygen Demand (BOD), also often referred to as biological oxygen demand, is a test performed to measure the potential of wastewater and other waters to deplete the oxygen level of receiving waters. In other words, the BOD test is performed to determine what effect dirty water, containing bacteria and organic materials, will have on animal and plant life when released into a stream or lake. Learn more here.
- What is conductivity?
Conductivity, also known as electrical conductivity, is used to measure the concentration of dissolved solids which have been ionized in a polar solution such as water. Read MANTECH’s conductivity method abstract here.
- What is a titration?
Titration uses a solution of known concentration to determine the concentration of an unknown solution. The titrant (the solution with a known concentration) is added from a buret to a known quantity of the analyte (the solution with an unknown concentration) until the reaction is complete. Knowing the volume of titrant added allows the concentration of the unknown solution to be determined.
- What is pH?
The potential of hydrogen (pH) is a measure of hydrogen ion (H+) concentration. Solutions with a high concentration of H+ ions have a low pH (acidic). Solutions with a low concentration of H+ ions have a high pH (alkaline). Read MANTECH’s pH method abstract here.
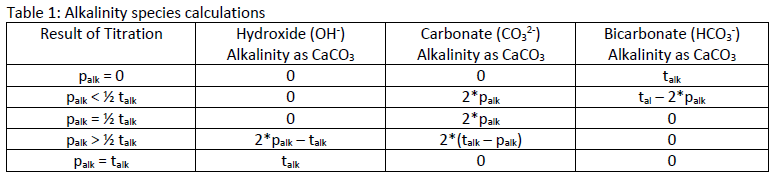
- What is alkalinity?
Alkalinity refers to the capability of water to neutralize acid, also known as an expression of buffering capacity. A buffer is a solution to which an acid can be added without changing the concentration of available H+ ions (without changing the pH) appreciably. In other words, a buffer absorbs the excess H+ ions and protects the water body from fluctuations in pH. Read MANTECH’s alkalinity method abstract here.
- What are Nitrates?
Nitrates (NO3) are formed from the two most common elements on earth, nitrogen and oxygen. Their presence in soils comes from nitrogen-fixing bacteria in the soil, decay of organic matter, industrial effluents, human sewage, and livestock manure. Nitrates are a serious problem since they do not evaporate, and hence remain dissolved and accumulate in the groundwater. Read MANTECH’s nitrate method abstract here.
- What is oxidation reduction potential (redox)?
Oxidation-reduction potential (ORP), also known as redox potential, refers to the capacity of a solution to oxidize (accept electrons) or reduce (donate electrons). ORP sensors work by measuring the voltage across a circuit formed between the indicator and reference electrodes. When an ORP electrode is placed in a solution containing oxidizing or reducing agents, electrons are transferred back and forth on the measuring surface, generating an electrical potential. Common applications for the ORP method include monitoring water chlorination processes for water disinfection, distinguishing between oxidizers and reducers present in wastewater, and metal screening. Read MANTECH’s redox potential method abstract here.
- What is Turbidity?
Turbidity is defined as the amount of suspended particles in a solution, measured in nephelometric turbidity units (NTU). It is used as a general indicator of the quality of water, along with colour and odour. The US EPA has a maximum contaminant level (MCL) of 5 NTU for drinking and wastewaters. Read MANTECH’s turbidity method abstract here.
- What is Salinity?
There are two types of salinity, absolute salinity and practical salinity. Absolute salinity is a ratio between the mass of dissolved material in seawater and the mass of the seawater. Practical salinity is the ratio of the electrical conductivity of a seawater sample to that of a standard potassium chloride (KCl) solution at the same temperature and pressure. Read MANTECH’s salinity method abstract here.
- What is Ammonia?
Ammonia is a colourless gas that is soluble in water and has a distinctive odour. It is a mild environmental hazard because of its toxicity and ability to remain active in the environment. Direct measurement of ammonia using a calibrated ion selective electrode (ISE) is a quick, accurate and precise way to easily determine ammonia levels. Read MANTECH’s ammonia method abstract here.
- What is Hardness?
‘Hardness’ is defined as the total concentration of alkaline earth ions (Ca2+, Mg2+, Sr2+ and Ba2+) in water. The Ca2+ and Mg2+ ions dominate the alkaline earth ions. Therefore, one can refer to total hardness as the total concentration of the Ca2+ and Mg2+ ions in solution. Hardness is expressed as mg CaCO3/L water sample (ppm CaCO3). Read MANTECH’s hardness method abstract here.
- What is total organic carbon?
TOC (Total Organic Carbon) is the amount of carbon based organic contaminants in a water system. TOC does not identify each specific organic contaminant present, but rather an absolute quantity of all carbon-bearing molecules. In other words, TOC is a way to measure organic contaminants that may pose a threat to drinking water or wastewater systems.
- What are THMs?
THMs (trihalomethanes) are disinfection by-products (DBP’s) formed when residual chlorine reacts with elevated levels of naturally occurring organic matter found in water. THMs are present in most drinking water supplies and are dependent on several factors such as type of organic material present and chlorine dosage.
- What is UV254?
UV254 is a water quality test which uses ultraviolet light of 254nm wavelength to measure natural organic matter in water and wastewater.
- What is natural organic matter?
Natural organic matter (NOM) is a critical target for drinking water treatment because it causes a negative effect on water quality by color, taste and odor, and can react with disinfectants to form disinfection by-products (DBP). There are several tools for measuring NOM in source and ground water that include total organic carbon (TOC), dissolved organic carbon (DOC), UV absorbance at 254 nm (UV254), specific UV absorbance (SUVA), and chemical oxygen demand (COD).
- What is oxygen demand?
OD (Oxygen Demand) measures the chemical reactivity of organics by the demand for oxygen, as shown in the diagram below. It can be used as an additional tool in the characterization of NOM (Natural Organic Matter) to predict DBP (Disinfection by-product) formation. This metric also allows for rapid feedback and optimization of coagulation and disinfection dose requirements.
- What is the method for Hot Acidity determination?
Hot acidity is a variation of the standard Acidity titration using NaOH, with some pretreatment steps performed before the titration. It is outlined in Standard Methods SM2310B, officially called “hot peroxide treatment procedure for acidity determination”. This method is applicable to mine wastes and other samples containing large amounts of metals such as heavy industrial WW.
From SM2310B:
- Use the hot peroxide procedure to pretreat samples known or suspected to contain hydrolysable metal ions or reduced forms of polyvalent cation, such as iron pickle liquors, acid mine drainage, and other industrial wastes.
- Hot peroxide treatment acidity method:
- Pipet sample volume into vessel
- Measure pH
- If pH > 4.0, add small increments of 0.02N H2SO4 to reduce pH to 4.0 or less
- Remove samples from MANTECH system
- Add 5 drops of 30% H2O2 and boil for 2 to 5 minutes
- Cool to room temperature
- Place samples back on MANTECH system and titrate with standard alkali (NaOH) to pH 8.3
- The calculation for hot acidity is shown below:
- Acidity = [((mL NaOH consumed)*(Normality of NaOH)) – ((mL H2SO4 consumed)*(Normality of H2SO4))*50,000]/Sample volume
- I have an Error Code displayed on my PeCOD Analyzer, what does it mean?
For information about what the error code displayed on your PeCOD Analyzer represents, click here.
- What is the measuring range for Dissolved Oxygen on MANTECH systems?
MANTECH systems utilize one of two dissolved oxygen probes from YSI for automated dissolved oxygen determination. The measuring ranges of both probes are listed below, along with a link to the complete specification sheets.
YSI FDO 4410 IDS Sensor
- Dissolved Oxygen Range: 0 to 20 mg/L
- Air Saturation Range: 0 to 200%
- Temperature Measurement Range: 0 to 50°C
- Technical Specifications
YSI ProOBOD Sensor
- Dissolved Oxygen Range: 0 to 50 mg/L
- Air Saturation Range: 0 to 500%
- Temperature Measurement Range: Ambient 10 to 40°C; Compensation -5 to 50°C
- Technical Specifications
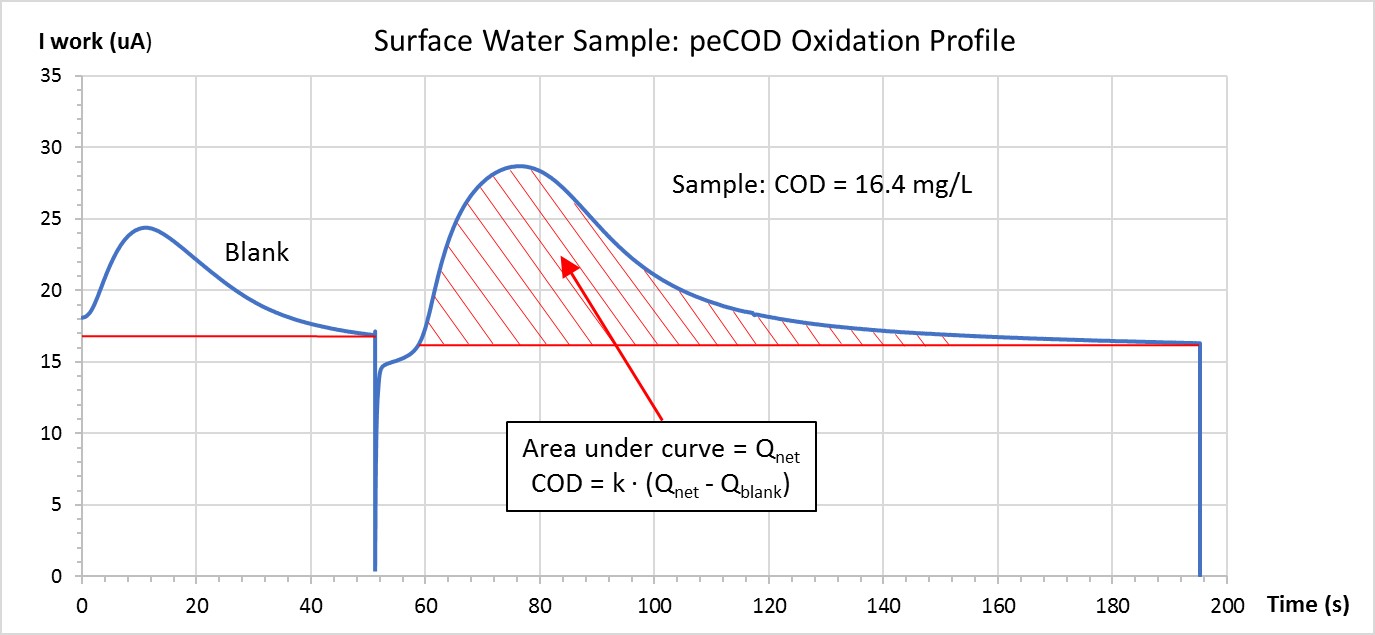
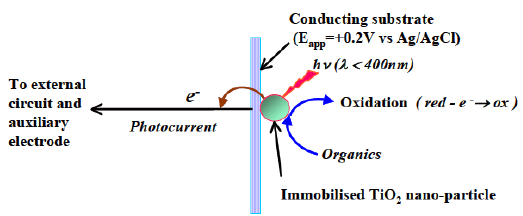
- How does the PeCOD Analyzer determine oxygen demand?
The PeCOD® Analyzer performs advanced oxidation on a small volume of sample. As the reaction proceeds, electrical charge is generated proportional to the oxygen being consumed. The PeCOD® analyzer captures this generated charge, plotting the output current from the reaction over time as shown below. The area under the curve generated by plotting current over time is proportional to the oxygen demand of the sample. A blank charge is also determined for each sample, and subtracted from the total charge to ensure accuracy.
View the detailed overview of peCOD technology and calculations here.

- How can I make Calibrant and Check Standard solutions?
View our instructions for producing 1L calibrants, check standards and for more information on these solutions: https://mantech-inc.com/wp-content/uploads/2020/09/1-L-calibrant-instruction.pdf
- How does the PeCOD method compare to BOD, TOC, and conventional COD?
There are several common methods to test wastewater and drinking water for organic pollutants, natural and chemical. Chemical Oxygen Demand (COD), Biochemical Oxygen Demand (BOD) and, Total Organic Carbon (TOC) compromise the three main methods of testing water samples. BOD and COD methods differ from TOC because they measure the amount of oxygen that is depleted by organic species in water. Moreover, TOC is a measure of all carbon (both organic and inorganic), rather than the oxygen that is reduced by these species. As written by a TOC manufacturer, “TOC on its own sheds no light on the oxidizability of the measured carbon or the amount of oxygen needed for its biodegradation.” Specific to COD, it measures the reactive fraction of the TOC. This is also known as oxidizability in the European Union.
View the full article: Comparison of COD, BOD and TOC Methods for organics, which summarizes the advantages and disadvantages of the COD, BOD and TOC methods, and compares them to the PeCOD method.
- Why did my PeCOD calibration fail?
It is possible that a PeCOD will fail its calibration. If this occurs, the PeCOD will notify you of the reason it did not pass. Common reasons are that the M value or C value are out of range. Please refer to page 19 of the PeCOD Pro Operation manual for more information.
- What does the change from ManSci to MANTECH mean for existing customers?
We have released new 2021 pricing, please contact us at [email protected] for pricing details and quotations.
Orders should now be placed with MANTECH. We are ready to complete vendor registration requirements, simply send requests for information to [email protected]. Ordering directly with MANTECH provides you a one stop shop ensuring efficient fulfillment, shipping and communication. Orders placed by USD credit cards are welcome. If required, orders can still be placed with ManSci as well.
We continue to appreciate your trust and investment in MANTECH products. We look forward to supporting your automated analysis requirements.
- Why did ManSci change their name to MANTECH?
ManSci has been MANTECH’s distributor for over 10 years. Following the acquisition in October 2020, ManSci is now MANTECH (USA) Inc. and a a wholly owned subsidiary of MANTECH. The exceptional ManSci and MANTECH Teams have now joined forces under one MANTECH brand ensuring outstanding quality, service and support to our customers directly from the manufacturer of MANTECH analyzers. Our North American Team is fully committed to our mission, specifically to “Optimize Your Results and Protect Our Environment.”
- How do I contact for support?
To get in contact with a representative regarding support for MANTECH products, please send an email to [email protected] or call us at +1-519-763-4245.
- How do I contact MANTECH?
To contact MANTECH regarding product information and general inquiries, you may call us at +1-519-763-4245 or send an email to [email protected]. You may also reach out to us directly through our website from the page linked here.
If you would like to inquire directly about a new or existing quotation, you may email our sales team directly at [email protected].
- How do I replace the membrane of my ammonia ion selective electrode (ISE)?
” target=”_blank” rel=”noopener noreferrer”>Watch this short and informative demonstration on how to replace the membrane on an Orion ammonia ion selective electrode (ISE).
- How do I prepare my water/wastewater sample for PeCOD Analysis using a homogenizer?
The following steps will outline how to correctly homogenize a water/wastewater sample for analysis with the PeCOD.
- Homogenize the raw sample for 2 minutes. Ensure you are using at least 50mL or more of sample.
- Prepare the sample with electrolyte in the range being used. Click here for the correct sample-to-electrolyte ratio for each colour range.
– For example, if you are using yellow range, take 2mL of sample plus 18mL of electrolyte.
– If dilution is required, prepare the dilution first with the homogenized sample, then prepare with electrolyte. - Homogenize the mixture of sample and electrolyte for 1 minute.
- Place the PeCOD intake tube (Port A) into the sample and press run the analysis.
- Rinse the homogenizer in deionized water, turn on for 30s while in DI water.
- Spray down homogenizer with DI water using a laboratory bottle with nozzle (common lab squeeze bottles).
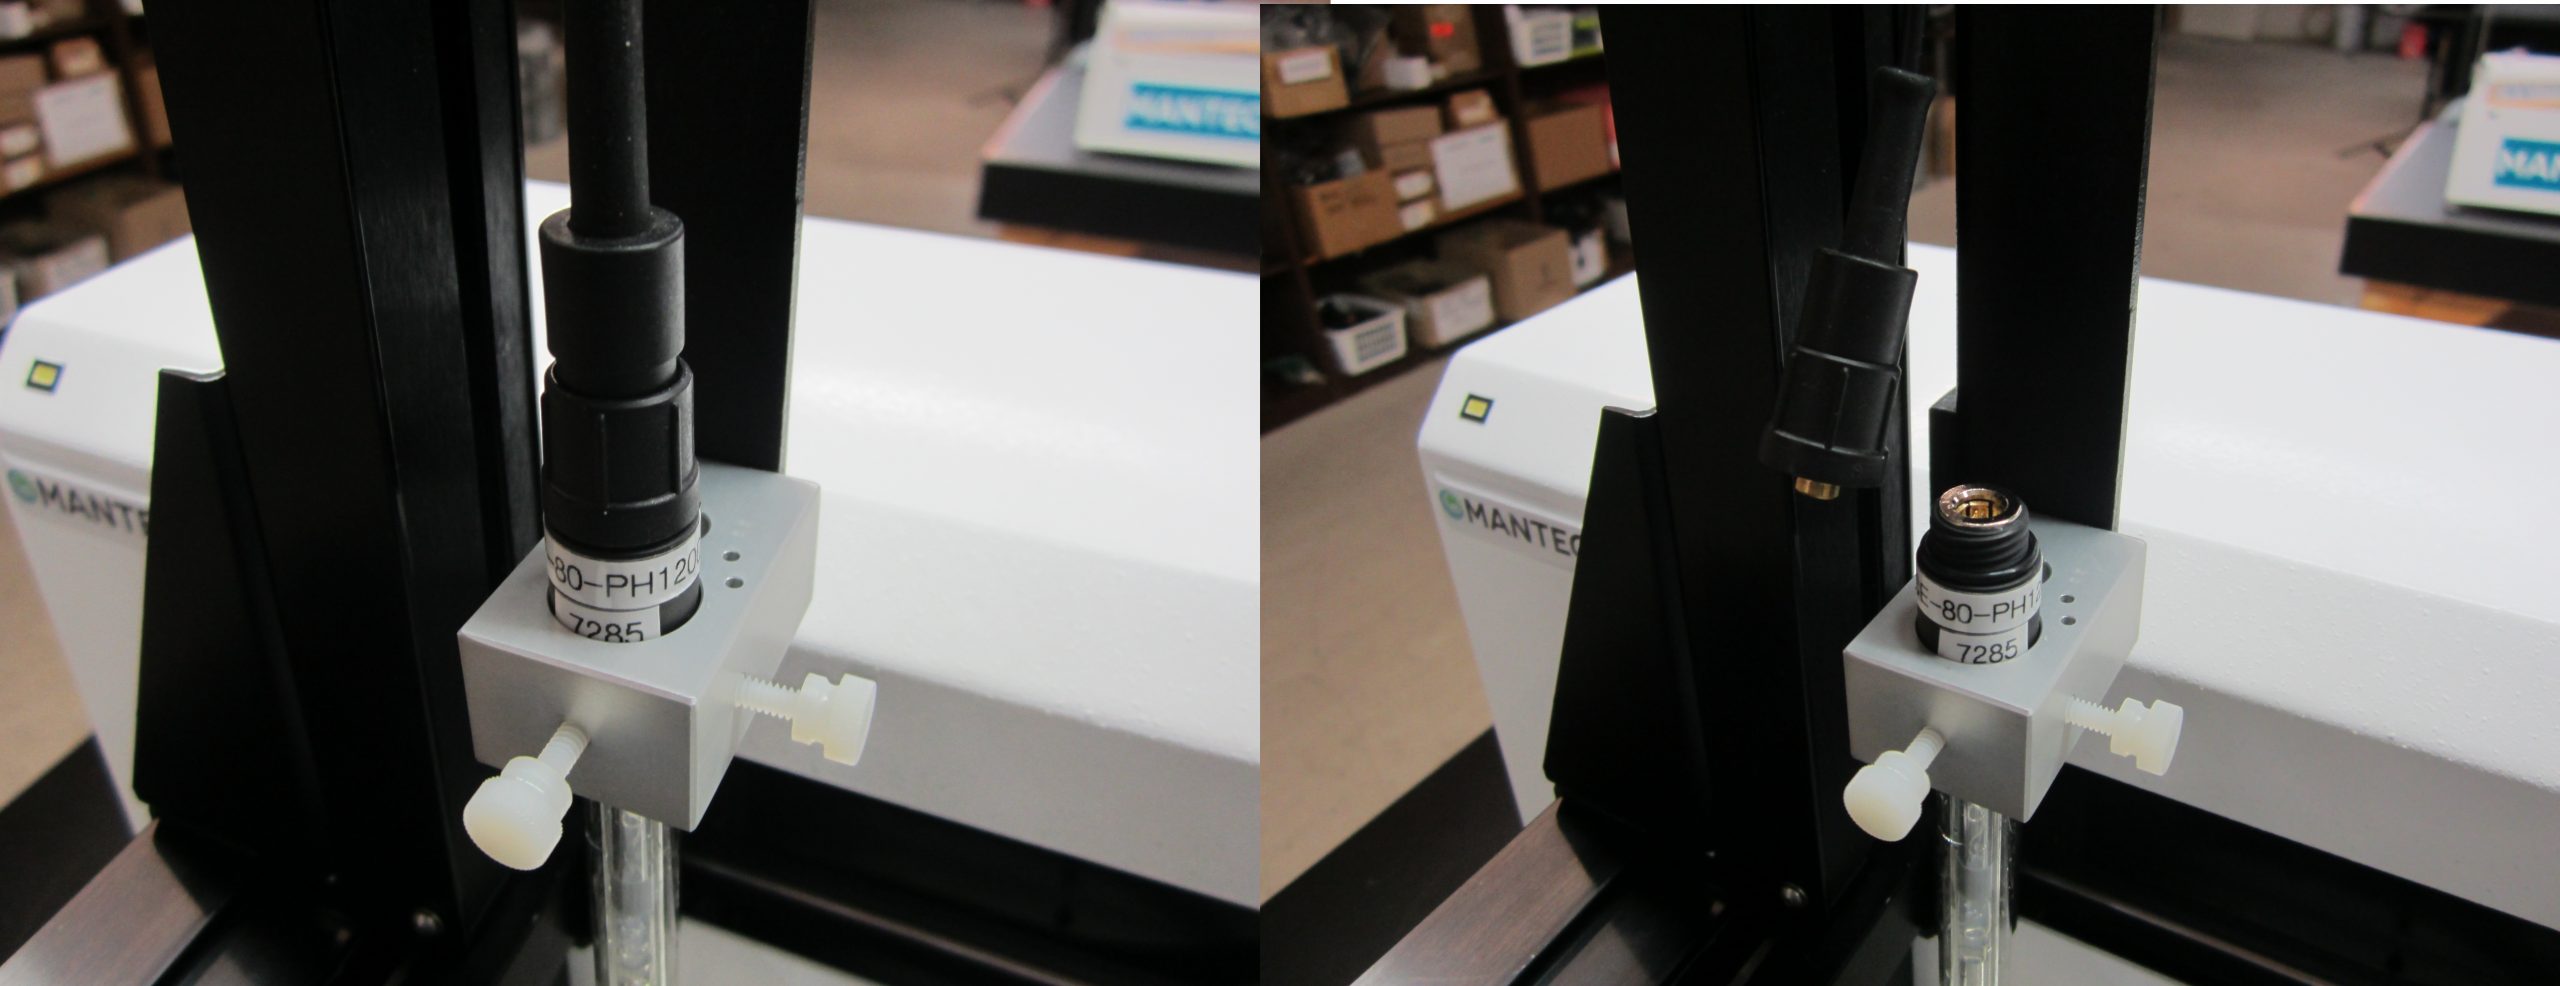
- How do I prepare my pH electrode for long-term storage or shipping?
To safely store or ship your MANTECH pH electrode, first fill the electrode with fill solution and fill the storage boot ¾ full with fill solution. Then, insert the probe into the boot and screw tight. Place the fill solution plug in its hole and parafilm over the plug, as well as around the body. Then, parafilm over the cable connection spot, making sure not to overlap with the parafilm around the plug.
- How do I retrieve calibration records from my YSI 4010 MultiLab IDS meter?
The YSI 4010 MultiLab IDS meter will store the records for the last 10 calibrations performed on the meter. The instructions for retrieving these calibrations can be found on Technical Bulletin 2021 – 010.
- What is the chemical compatibility of the tubing in MANTECH pumps?
The tubing used in MANTECH peristaltic and metering pumps is compatible with many types of chemicals. The following is a list of chemicals that are not recommended to be used with MANTECH tubing/pumps.
*Chemicals without listed concentrations are assumed to be 100% concentrations/the maximum percent solubility in water.
Acetaldehyde Ethyl Benzoate Methyl Methacrylate Acetone Ethylene Bromide Mineral Oil Aliphatic Hydrocarbons Fluoboric Acid, 48% in w Mineral Spirits Amyl Alcohol Fluorine Gas Motor Oil Aqua Regia Formaldehyde, 37% in w Naphtha Aromatic Hydrocarbons Fuel Oil Naphthalene ASTM Reference No. 2 Oil Furfural Nitric Acid, 68-71% in w ASTM Reference No. 3 Oil Gasoline, Automotive Nitrobenzene Benzaldehyde Heptane Nitromethane Benzene Hexane Oils, Essential Benzenesulfonic Acid Hydrobromic Acid, 20 -50% in w Oils, Hydraulic (Phosphate Ester) Bromine, Anhydrous Liquid Hydrobromic Acid, 100% in w Oils, Hydrocarbon Butyl Alcohol Hydrofluoric Acid, 10% in w Ortho Dichlorobenzene Carbon Disulfide Hydrofluoric Acid, 25% in w Paraffins Carbon Tetrachloride Hydrofluoric Acid, 40 -48% in w Picric Acid, 1% in w Chlorine, Wet Gas Isooctane Skydrol 500A Chlorobenzene, Mono, Di, Tri Jet Fuel, JP8 Styrene Monomer Chloroform Kerosene Sulfur Chloride Chlorosulfonic Acid Ketones Sulfuric Acid, 95-98% in w Cresol (m, o, or p) Lemon Oil Tetrahydrofuran Cyclohexane Limonene-D Toluene Cyclohexanone Lubricating Oils, Petroleum Trichloroethylene Diesel Fuel Methyl Ethyl Ketone (MEK) Turpentine Dioxane Methyl Isobutyl Ketone Xylene - How do I store my MANTECH Electrodes?
MANTECH recommends storing pH and other electrodes immersed in a 1:10 dilution of pH 4 buffer in Tap Water. Conductivity electrodes can be stored in air for system configurations that do not place it on the same holder as another electrode.
For MANTECH’s ion-selective electrodes, MANTECH recommends each ion should be stored in a dilute solution of the ion that it measures. For example, store your chloride electrode in a solution of 1.0 x 10⁻² M chloride solution.
For a full list of electrodes and their recommended storage, please click here.
- How do I clean my color flow cell?
For optimal performance the flow cell should be cleaned from once a year to once a month, depending on the type of samples being analysed. Manually pump 50 ml of 0.1 N Hydrochloric Acid into the color module and leave the cell to soak overnight. In the morning, pump 100 ml of deionized water through the module to rinse the cell. This process can be automated to occur after every rack of samples run.
- What is your warranty policy?
MANTECH Instruments are warrantied for a period of one year (unless otherwise specified) from the date of shipment. This warranty covers defects in material and workmanship (parts and labour), under normal installation, use and maintenance, within the region of installation, as described in the operator’s instructions. Please refer to the user’s manual. This warranty does not cover Computer products, YSI branded products, PRO Scientific Homogenizers, non-MANTECH branded electrodes/probes, parts, consumables, expendable items or items with physical damage. Warranty/service for items not covered are to be handled direct by the endusers through the manufacturer or the local distributor.
For MANTECH’s warranty policy for electrodes, CLICK HERE.
- How does MANTECH account for temperature compensation and correction in pH measurements?
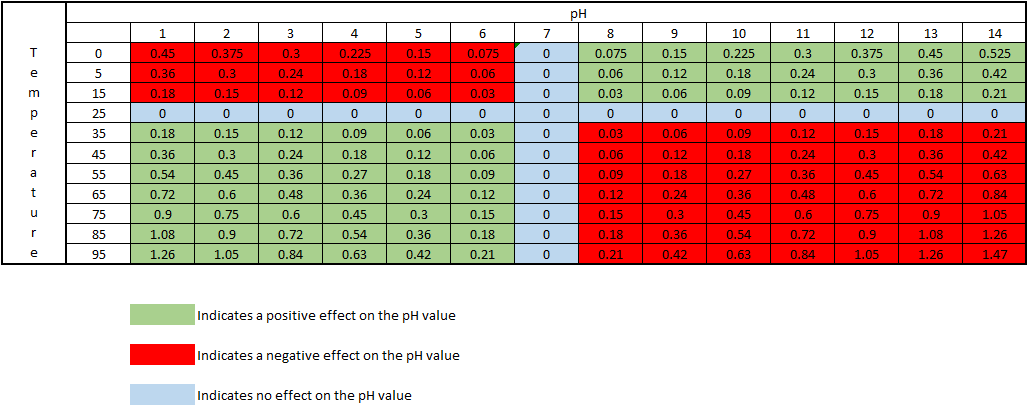
As the temperature of a solution changes, the actual pH changes. This is not an error of the probe or meter being used, but is the actual pH of the solution at that particular temperature. The temperature effect on the pH value is 0.003 pH units per oC away from 25oC, per pH units away from pH 7. This effect can be either negative or positive, depending on if the temperature is above or below 25oC, and if the pH is above or below pH 7. At 25oC and pH 7, there is no change in the pH value.
The chart below shows how the actual pH changes with temperature and pH, which allows you to correct the pH reading to 25oC. As an example, if a sample measured pH 5 at a temperature of 5oC, the chart indicates this a negative effect, therefore the sample pH would be 5 – 0.12 = 4.88pH corrected to 25oC:

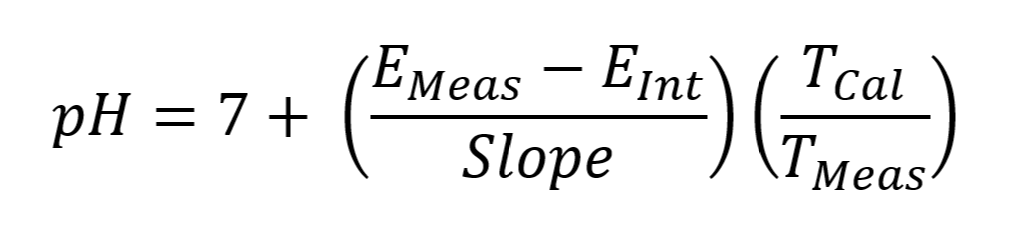
MANTECH software accounts for temperature by recording the temperature during calibration via a thermistor probe, then it corrects the pH reading at the time of measurement to account for the difference in measured temperature of the sample vs. the calibration buffers. The reported pH value is the corrected value @ the sample temperature. The equation below shows how the PC-Titrate software calculates pH:

EMeas = Voltage measure by electrode at the time of titration (mV)
EInt = Voltage of the Intercept value calculated from the calibration equation. (mV)
Slope = slope of the line calculated from the calibration equation. (mV)
TMeas = temperature measured at the time of pH measurement (K degrees)
TCal = temperature taken at the time of last calibration. (K degrees)
MANTECH also offers the option to report pH values corrected to a set temperature, such as 25°C. This is implemented in the software as an additional step after the sample pH is recorded. MANTECH offers this as a feature for new MT-Series systems, or as an upgrade to existing MANTECH systems.
For more information please follow this link or contact us at [email protected].
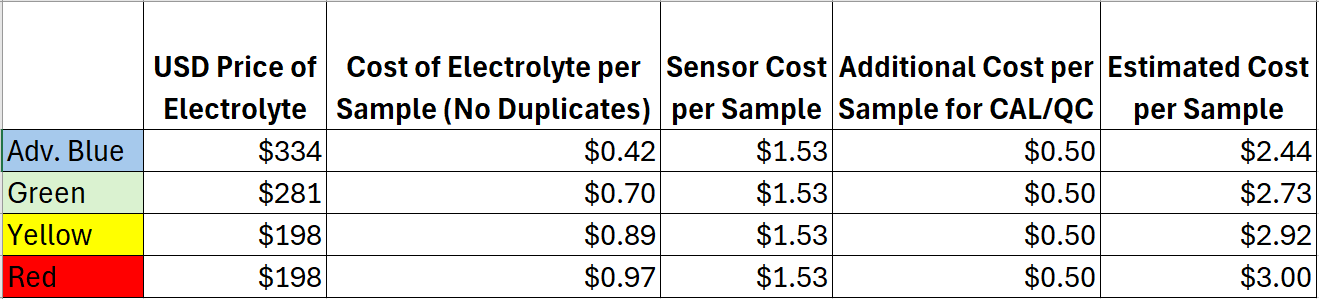
- How many PeCOD samples can be analyzed with the reagent starter kit I received?
New PeCOD Analyzer orders typically include a slurry reagent starter kit providing the consumables to run the PeCOD analysis. These kits consist of Electrolyte, Calibrant, and Secondary Standard slurry reagents. Electrolyte is the reagent that is mixed with each sample, therefore it is typically the reagent to be used up first, requiring the user to purchase more from MANTECH. It is useful to know on average how many samples can be run with the electrolyte provided in the standard reagent starter kits, therefore we provide this information below.
You will need to know the color operating range of your PeCOD (Adv. Blue, Green, Yellow, or Red). If you plan to run a single analysis per sample, use the left column for 10mL total volume. If you require duplicate or triplicate analysis per sample, use the right column for 20mL total volume. Depending on how many samples are run per calibration, these numbers may vary.
10mL Total Volume – Single Analysis 20mL Total Volume – Duplicate and Triplicate Analysis For Advanced Blue range (3:1): - 7.5mL sample required
- 2.5mL electrolyte required
- 2L electrolyte provided in starter kit
- 800 samples can be run
For Advanced Blue range (3:1): - 15mL sample required
- 5mL electrolyte required
- 2L electrolyte provided in starter kit
- 400 samples can be run
For Green range (1:1): - 5mL sample required
- 5mL electrolyte required
- 2L electrolyte provided in starter kit
- 400 samples can be run
For Green range (1:1): - 10mL sample required
- 10mL electrolyte required
- 2L electrolyte provided in starter kit
- 200 samples can be run
For Yellow range (1:9): - 1mL sample required
- 9mL electrolyte required
- 2L provided in starter kit
- 222 samples can be run
For Yellow range (1:9): - 2mL sample required
- 18mL electrolyte required
- 2L provided in starter kit
- 111 samples can be run
For Red range (1:49): - 0.2mL sample required
- 9.8mL electrolyte required
- 2L provided in starter kit
- 204 samples can be run
For Red range (1:49): - 0.4mL sample required
- 19.6mL electrolyte required
- 2L provided in starter kit
- 102 samples can be run
Number of samples that can be run with 10L bottle of electrolyte: - Adv. Blue range, 4000 samples
- Green range, 2000 samples
- Yellow range, 1111 samples
- Red range, 1020 samples
Number of samples that can be run with 10L bottle of electrolyte: - Adv. Blue range, 2000 samples
- Green range, 1000 samples
- Yellow range, 555 samples
- Red range, 510 samples
Note: 5x Electrolyte slurry packages are required for making up 10L. - What temperature should my PeCOD samples be analyzed at?
The temperature range that PeCOD samples should be analyzed is between 10 to 30°C. For samples that are outside of this temperature range, the addition of electrolyte (which is stored at room temperature) prior to analysis will help to bring the sample solution to an acceptable temperature range.
- What does high BOD indicate?
BOD indicates the amount of putrescible organic matter present in water. Therefore, a low BOD is an indicator of good quality water, while a high BOD indicates polluted water. Dissolved oxygen (DO) is consumed by bacteria when large amounts of organic matter from sewage or other discharges are present in the water.
- What happens if COD is high?
Higher COD levels mean a greater amount of oxidizable organic material in the sample, which will reduce dissolved oxygen (DO) levels. A reduction in DO can lead to anaerobic conditions, which is deleterious to higher aquatic life forms.
- What causes high COD in wastewater?
COD increases as the concentration of organic material increases. It also increases if inorganic compounds susceptible to oxidation by the oxidant (typically dichromate) are present. Water with high COD typically contains high levels of decaying plant matter, human waste, or industrial effluent.
- What is the BOD of raw sewage?
BOD can also be defined as the amount of oxygen required by the micro-organisms in the stabilization of organic matter. The results are generally expressed as the amount of oxygen taken by one litre sample (diluted with aerated water) when incubated at 20 degree for five days. BOD of raw sewage is 300-600 mg/litre.
- What is the COD to BOD ratio in domestic sewage influent?
BMS have recorded average ratios of 2-3 mg/l COD to 1 mg/l BOD over its 30 years of business. Influent COD in normal domestic sewage is therefore generally 600 – 900 mg/l and it is then treated to at least 30 -100 mg/l before discharge to minimize pollution potential.
- Why is COD higher than BOD?
COD is normally higher than BOD because more organic compounds can be chemically oxidised than biologically oxidised. This includes chemicals toxic to biological life, which can make COD tests very useful when testing industrial sewage as they will not be captured by BOD testing
- How do I store my PeCOD sensor?
On a day to day basis, the PeCOD sensor inside the Analyzer head, in the same location as it is placed for operation. At the end of each analysis and calibration, the PeCOD primes the sensor line with blank solution to provide a clean environment similar to operating conditions for storage. An alternative to this is to prime DI water manually through Port A of the PeCOD at the end of a day’s operations.

When the PeCOD is not going to be used for some time, for example a week or longer, it is good to remove the sensor from the unit for long term storage. This is done by first removing the Port A and B tubes from liquid, then priming those lines with air. Then, press on the front latch to open the analyzer head and access the sensor. The sensor can then be lifted off the alignment pins. Once removed, it is important to use a syringe to “dry” the internal channels of the sensor. Fill a 10mL syringe with air, then press the syringe (without a tip) against the holes in the back of the sensor. Push the syringe down to push air through the sensor channels. Perform these steps on each of the holes in the back of the sensor, in the following order:

Once dry, place face down on a dry surface to finish the drying process. Next, place the sensor in a cool, dark place for long-term storage. The sensor packaging works as a suitable package for long term storage after properly drying the sensor.
- What is the shelf life of a PeCOD sensor?
If left unopened and sealed in the package, PeCOD sensors have a shelf life of 12 months. Once opened and in use, sensors can be expected to last for approximately 1 month or 200 samples (whichever comes first).
- Will PeCOD® correlate with my BOD results?
The PeCOD® measures COD through a rapid 10-minute photoelectrochemical oxidation, allowing for the accurate monitoring of a wide range of concentrations in real-time. These COD readings can be used to reliably estimate BOD by applying a correlation coefficient. When compared to the standard BOD test, the PeCOD can estimate BOD concentration within a 95% confidence level.
Some examples of correlation coefficients of PeCOD/BOD that have been determined for different types of industrial wastewater are provided in the table below.

- Do I need a stirrer for my conductivity measurements?
MANTECH utilizes rapid dipping of conductivity probes into sample tubes to mix samples and ensure a stable analysis of conductivity from the probe. This style of mixing is applicable to systems featuring a 12mm conductivity probe dipping into 50mL sample tubes, and systems featuring a 5mm conductivity probe dipping into 15mL sample tubes.
For all other combinations of probe and sample vessel, a stirrer is required to ensure proper mixing is achieved.
- What is the recommended type of standard for automated Turbidity Calibrations and Quality Control?
MANTECH recommends the use of turbidity standards made with suspensions of microspheres of styrene-divinylbenzene copolymer for all turbidity applications. Standard Methods dictate that “Secondary standards made with suspensions of microspheres of styrene-divinylbenzene copolymer typically are as stable as concentrated formazin and are much more stable than diluted formazin.”
Any dilutions used to prepare turbidity standards, as well as blanks, must use degassed DI water. This is especially important for accurate low-end turbidity analysis, as there is often a positive bias due to bubbles introduced into the DI water solution when it is being produced/dispensed. This effect becomes more noticeable with lower NTU readings, and can cause challenges with performing an accurate calibration. To degas DI water, it must be dispensed into a very clean bottle or container, and left to sit for ~24h. You will see bubbles form on the side of the container as the water degasses. After degassing, it is ready to use for blanks and standards preparation.
- What is the wavelength measured for Turbidity by Standard Methods (White Light)?
Standard Method 2130B (Nephelometric Method) specifies that a laboratory or process nephelometer should have a detector system with a spectral peak response of 400 to 600 nm. MANTECH’s T10 Turbidity meter and automated turbidity applications conform to this requirement.
- How do I clean my conductivity probe?
For water soluble contaminants, rinse probe in deionized (DI) water. If ineffective, soak probe in warm DI water with household detergent for 15 – 30 minutes.
For oil-based contaminants, rinse probe in ethanol or acetone for short (5-minute) periods.
After cleaning, rinse probe in DI water to remove residual cleaning reagents. Perform a meter calibration before proceeding with sample analysis.
- What is the Time of Analysis for Different Parameters?
The timing for analysis of different parameters depends on a few different factors, like the concentration of the sample and the equipment used.
Another factor is the total available sample volume in the vessel on the AutoMax Autosampler bed. With some combinations of parameters, larger sample volume allows for simultaneous measurements, resulting in faster total analysis time than sequential measurement. A larger sample volume may require a larger sample cup, which decreases capacity on the same model Autosampler. In some, the cases the same set of parameters can be analyzed in 2-5 minutes faster when using the 125ml cups vs 50ml tubes.
It is important to understand your customers’ requirements in terms of capacity and throughput speed, total batch capacity required and/or daily sample loads and if overnight, unattended analyses will be applicable.
*** Note that all times of analysis are halved if Dual-Analysis option is included with system***
Individual Parameters

Combined Parameters
MT-10 & MT-30 Models

MT-100 Model

* Alkalinity titrations may take between 1-3 minutes depending on sample concentration. Times estimated assuming 50ppm alkalinity concentration.
EC = Electrical Conductivity
- What is used as a quality check standard for PeCOD?
A separate standard produced by Sigma Aldrich is used for quality control testing of PeCOD systems. This allows for verification of results and ensures that the system in use produces trusted values. This secondary standard can be diluted into different concentrations, making its use applicable to all COD ranges of solution used with the PeCOD analyzer. The Sigma Aldrich SKU number for this standard is QC1130.
- What are the Different Types of Calibration Profiles?
Calibrations can be linear, logarithmic, single-line, and multi-line fit.
The calibration method used depends on the method required.
pH and Color calibrations are linear, single-line fit calibrations.

Conductivity and Turbidity calibrations are multi-line, linear type calibrations.

ISE (Fluoride, Chloride, Ammonia, etc.) use a logarithmic multi-line calibration type.

- What are the benefits of IntelliRinse?
IntelliRinse™ is beneficial because it uses real-time measurement to provide confirmation that your probes are 100% clean, eliminating chances of cross-contamination.
Active IntelliRinse™ systems allows users to set user-defined values (e.g. rinse to a specific conductivity value) or to adjust the rinse intensity based on previous sample concentrations before moving to the next sample. This is beneficial as it improves the rinsing of probes/electrodes to ensure that cross-contamination does not occur even with particularly dirty or high-strength samples. There is also the option to have the final value measured during rinsing shown in a column on the results report, for a visual confirmation directly with sample results.
- How does PC-BOD calculate BOD when samples have failed BOD Method criteria?
- If all samples fail the final DO rule, the software will report the value for the sample with the highest dilution (lowest sample volume) and display a greater than (>) symbol.
- If all samples in a set fail the depletion rule and the BOD of the bottle with the lowest dilution (highest sample volume) is greater than the minimum detection, the software will report the value for the sample with the lowest dilution (highest sample volume) and display a less than (<) symbol.
- A less than symbol (<) will appear when all samples in a set have a depletion of less than that specified in the BOD Method. If the BOD of the bottle with the lowest dilution (highest sample volume) is less than the minimum detection for a given sample condition, the average will be displayed as follows:
- Diluted samples with no seed added < 2 mg/L
- Diluted samples with seed added < 1 mg/L
- Undiluted samples with no seed added < 0.1 mg/L
- Undiluted sampled with seed added < 0.0 mg/L
- How do I change the buret IP address?
MANTECH Burets have a static IP address assigned to them. These addresses can be changed if there are communication issues between the Buret and the software. To avoid IP address conflicts, MANTECH recommends that all Burets on the same network have unique IP addresses, not just ones on the same system. If an IP address needs to be changed, then you can manually change it using the following steps:
1.Open the Network and Sharing Centre on your computer through the advanced network settings, or through searching on the Control Panel.
2. Open Command Prompt on your computer by searching it in your Windows Search Engine.
3. Extract this folder to your computer.
4. Plug in the burette. In the Network and Sharing Centre, find the active network for the buret (ethernet connection) and open the properties by selecting the blue “Ethernet”. Open the properties.

5. Internet Protocol Version 6 should be unselected, and Internet Version 4 should be selected. Click OK and open the Details for the ethernet status. The Value for IPv4 Address should be 192.168.1.1. If not, change the IP address in the Internet Protocol Version 4 properties.

6. In Command Prompt, type in ping and the IP address found on the back of the buret and then the enter key. For example, “ping 192.168.1.50” without the quotations and the enter key. The
buret should reply.
7. Open the Buret_IP_Change folder now on your computer and open the application that is in the bin
subfolder.8. Type in the IP address and “Connect”. Click OK. Then type in the new IP address and select “Set IP”.


9. In Command Prompt again, ping the new IP address to ensure it works.
Specific notes:
- If the IP address is not known, then in command prompt, type in “arp -a” without the quotes and the IP address for the buret will be given as the first line under the IPv4 Address Value. This can be done after Step 5.

- If using PC-titrate, ensure that the version used is 889 or later. Previous versions do not support the ethernet Burets without an upgrade. Contact [email protected] for the ethernet buret software upgrade.
- If using MANTECH Pro, you can find the IP address of the buret (if it is not the one already in the address line) in hardware configuration using the “Configure Adapter”. The software will find the IP address that works for that buret and can be used to test the ping as well for buret response.
- Why is my conductivity analysis reporting negative values?
The reason you may have negative conductivity values at the low end is that there is a PC-Titrate software calibration being applied on the raw conductivity values from the meter. They are not wrong and it means the value is zero (0). You see this often with DI water measurements. If you turned off the software calibration then you would get the exact same values as displayed on the conductivity meter.
- What is the difference between the benchtop and portable PeCOD?
The L50 PeCOD® Analyzer is applicable for benchtop and portable use, with the incorporation of an external battery and carrying case. The L50 weighs less than 7kg and measures 280mm x 210mm x 260mm. Its rugged carrying case, equipped with wheels, makes it easy and safe to transport the unit between the field and the laboratory.

Person wheeling the portable peCOD carrying case.
- What is the typical initial PeCOD shipping weight and dimensions?
An investment in the safe, green, and fast PeCOD Analyzer and method includes the PeCOD L50 Analyzer, starter kits, and consumables. This is typically packed in two cartons with the following weight and dimensions:
Box 1 (starter kits and consumables)
16” x 15” x 14”, 32lbs
41cm x 39cm x 36cm, 15kgBox 2 (PeCOD L50)
16” x 15” x 16”, 21lbs
41cm x 39cm x 41cm, 10kg - How do I remove my electrode for maintenance?
Most MANTECH electrodes are connected to the Interface module via a BNC cable with a detachable S7 connection. This S7 connection is located at the electrode cable junction, allowing for easy detachment from the cable, and removal of the electrode while leaving the cable in place. This applies to all electrodes except the Ammonia Electrode and all Conductivity electrodes. See below for pictures of a pH electrode with the S7 connection attached, and detached.

- How is a Method Detection Limit (MDL) defined?
A Method Detection Limit (MDL) is defined in slightly differring ways by the US EPA, and the APHA. The definitions are briefly described below:
MDL as per US EPA:
The method detection limit (MDL) is defined as the minimum measured concentration of a substance that can be reported with 99% confidence that the measured concentration is distinguishable from method blank results.MDL as per APHA:
(MDL) is defined as the constituent concentration that, when processed through the entire method, produces signal that has a 99% probability of being different from the blank. - How does MANTECH account for temperature compensation and correction in conductivity measurements?
Conductivity is a temperature dependent measurement. All substances have a conductivity coefficient which varies from 1% per °C to 3% per °C for most commonly occurring substances. The automatic temperature compensation on the MANTECH Conductivity meter defaults to 1.91% per °C, this being adequate for most routine determinations.
Temperature-corrected Conductivity is calculated by:
- Subtract the current temperature of your standard from 25°C (or whichever reference temperature applies).
- Multiply the result by 1.91% which is your default temperature coefficient.
- Multiply the result by the uncorrected conductivity value.
- Add the result to the uncorrected conductivity value. If the sample temperature is higher than the reference temperature, the result of step 1, 2, and 3 are negative numbers so it is a subtraction from the uncorrected conductivity value.
- The result is the corrected conductivity value.
Example: Uncorrected conductivity value is 1200uS, current temperature is 21.4°C, reference temperature is 25°C, default correction factor of 1.91%
- 25.0 – 21.4 = 3.6
- 3.6 * 0.0191 = 0.06876
- 0.06876 * 1200 = 82.51
- 1200 + 82.51 = 1282.51uS <— Temperature Corrected Value for Reference Temperature 25°C
Conductivity readings varying with temperature may be due to the substances under test having a coefficient other than the typical value of 1.91% per °C. To eliminate this variation it is necessary to maintain all samples at the reference temperature by use of a thermostatic water bath or equivalent.
Adjustment may be made by entering the 4510 conductivity meter SETUP menu and selecting COEFF. The reading can then be adjusted to the required value (0.00 to 4.00) by using the keypad. A setting of 0.00 will mean that there is no temperature compensation being applied.
- What is the difference between 2-pole and 4-pole conductivity probes?
4-pole sensors have a much broader linear measurement range and are not sensitive to contamination.
- How much bench space do I require for a typical PeCOD L50 set-up?
The typical benchtop L50 set up requires 36 inches x 18 inches of bench space, as shown in the figure below.

- Why does my PeCOD plot more than one curve during calibration and sample analysis?
For calibration, the PeCOD® Analyzer goes through the following phases:
- Normalization Phase. This is where the PeCOD® Analyzer is adjusting the LED lamp output, trying to achieve a baseline of 20µA.
- Burn-In Phase (port B). This is where the pre-mix blank solution is brought into the sensor cell. It is oxidized to remove contaminants from the cell.
- Pre-Burn Phase (port B). This is where a new aliquot of pre-mix blank solution is brought into the sensor cell. This phase removed more contaminants from the cell and conditions the cell for the pre-mix blank.
- Oxidation (port B). A new aliquot of pre-mix blank is brought into the sensor cell and is oxidized. This value is used in the peCOD calculation. The area under this curve is used to calculate the ‘blank charge’, which corresponds to the C value determined by each calibration. This is the small amount of COD contributed by the electrolyte reagent, which is then subtracted from all future COD analyses to give the final COD result.
- Pre-Burn (port A). A new aliquot of pre-mix calibrant solution is brought into the sensor cell where it is oxidized. This removes contaminants from the cell and conditions the cell for the pre-mix calibrant.
- Oxidation phase (port A). A new aliquot of pre-mix calibrant if brought into the sensor cell. This value is used in the peCOD calculation. The area under the curve is used to calculate the reference charge, which is used with the blank charge to determine the relationship between charge and COD. This corresponds to the M value determined by each calibration.
For sample analysis, the PeCOD® Analyzer goes through the following phases:
- Burn-In phase (port B). The pre-mix blank solution is brought into the sensor cell and is oxidized. This removed contaminants from the cell.
- Pre-Burn phase (port A). An aliquot of sample is brought into the sensor cell and is oxidized. This removes contaminants from the cell and conditions the cell for the sample.
- Oxidation phase (port A). A new aliquot of sample is brought into the sensor cell and is oxidized. This value is used in the peCOD calculation. The area under the curve is used to calculate the charge generated by sample oxidation. The blank value will be subtracted from the sample value to determine the sample COD.
- Where can I find our certificates of analysis?
All certificates of analysis can be found on our Dropbox. Please click here to be redirected to the C of A page, then choose the appropriate folder.
- What computer specifications are required to run MANTECH software?
The minimum computer specifications can be found here for MANTECH Pro and BOD Pro software packages.
Please see this technical bulletin for the minimum requirements for PC-Titrate and PC-BOD software. Note that these software packages have been discontinued and support can no longer be guaranteed.
- Where can I find our SDS's?
The SDS’s to all solutions are posted on our Dropbox. Please click here to be redirected to the SDS page, then choose the appropriate folder.
- What is our mailing address?
Our mailing address in Canada is 5473 ON-6 N, Guelph, ON N1H 6J2.
Our mailing address in the USA is 22676 Island Pines Way, Unit 243, Fort Myers Beach, Florida 33931.
- Do we accept credit card payments?
Yes, we do accept credit card payments. To make a payment with credit card please call us at +1.519.763.4245.
- How do I place an order?
To place an order, please email us at [email protected] or call us at +1.519.763.4245 . To ensure quick processing, orders should reference a MANTECH Quotation number. To inquire about pricing and receive quotations for MANTECH products, please send an email to [email protected].
- What is the minimum total liquid volume that can be measured for pH, conductivity and alkalinity with the MT Systems?
When using 50mL sample tubes, the minimum total volume can be as small as 6 ml using the TitraPro4 pH electrode and the MANTECH 5mm conductivity probe. This is due to the lower immersion depth of these electrodes and precise autosampler coordinate specifications. When using 125mL sample cups, the minimum total volume can be as small as 15mL.
- What should I do if my titration standard is measuring too high or too low?
If your titration standards are not reading the correct concentrations, for example, the alkalinity standard reading is low, first make sure the titrant has been standardized. Secondly, the precision of the results can indicate if this is a mechanical or chemical problem. If the results are precise, it is likely a chemical issue. Check your standards and titrant standardization. It is also possible that the sample volume may be incorrect.
- What is the sample capacity for each AutoMax Sampler based on available tube and cup styles?
Each of our AutoMax samplers are compatible with a variety of common sample cup and tube styles to accommodate up to 4 probes. To view available sample vessels and AutoMax sample capacities, read our technical bulletin here.
- Why is the pH electrode slope and measuring characteristics different for higher pH values, for ex pH 13?
Changes to slope at higher pHs
Alkaline Error or Sodium Error occurs when pH is very high (e.g. pH 12) because Na+ concentration is high (from NaOH used to raise pH) and H+ is very low.
Electrodes respond slightly to Na+ and give a false low reading. This is related to the concept of selectivity coefficients where the electrode responds to many ions but is most selective for H+. This problem occurs because Na+ is 10 orders of magnitude higher than H+ in the solution.
High pH electrodes use a 0-14 pH glass. This electrode will read pH 14 (1 M NaOH) to be around pH 13.7 with a 0.3 pH sodium error.
A standard pH electrode uses a 0-12 pH glass. The electrode will read pH 14 (1 M NaOH) to be around pH 12.4 with a 1.6 pH sodium error.
Alkaline error
The alkaline effect is the phenomenon where H+ ions in the gel layer of the pH-sensitive membrane are partly or completely replaced by alkali ions. This leads to a pH measurement which is too low in comparison with the number of H+ ions in the sample. Under extreme conditions where the H+ ion activity can be neglected the glass membrane only responds to sodium ions. Even though the effect is called the alkaline error, it is only sodium or lithium ions which cause considerable disturbances. The effect increases with increasing temperature and pH value (pH > 9), and can be minimized by using a special pH membrane glass.
Sodium Ion Error
Although the pH glass measuring electrode responds very selectively to H+ ions, there is a small interference caused by similar ions such as lithium, sodium, and potassium. The amount of this interference decreases with increasing ion size. Since lithium ions are normally not in solutions, and potassium ions cause very little interference, Na+ ions present the most significant interference.
Sodium ion error, also referred to as alkaline error, is the result of alkali ions, particularly Na+ ions, penetrating the glass electrode silicon‐oxygen molecular structure and creating a potential difference between the outer and inner surfaces of the electrode. H+ ions are replaced with Na+ ions, decreasing the H+ ion activity, thereby artificially suppressing the true pH value. This is the reason pH is sometimes referred to as a measure of the H+ ion activity and not H+ ion concentration.
Na+ ion interference occurs when the H+ ion concentration is very low and the Na+ ion concentration is very high. Temperature also directly affects this error. As the temperature of the process increases, so does the Na+ ion error.
Depending on the exact glass formulation, Na+ ion interference may take effect at a higher or lower pH. There is no glass formulation currently available that has zero Na+ ion error. Since some error will always exist, it is important that the error be consistent and repeatable. With many glass formulations, this is not possible since the electrode becomes sensitized to the environment it was exposed to prior to experiencing high pH levels. For example, the exact point at which the Na+ ion error of an electrode occurs may be 11.50 pH, after immersion in tap water, but 12.50 pH after immersion in an alkaline solution.
Controlled molecular etching of special glass formulations can keep Na+ error consistent and repeatable.
This is accomplished by stripping away one molecular layer at a time. This special characteristic provides a consistent amount of lithium ions available for exchange with the hydrogen ions to produce a similar millivolt potential for a similar condition.
- Why do I need to standardize my NaOH titrant?
NaOH is highly hygroscopic, meaning that it absorbs water from the air. Therefore, over time the titrant will become more dilute as it absorbs water. NaOH can be standardized by titrating into a sample of potassium hydrogen phthalate (KHP) of known concentration. For example, titrate 0.05 N KHP with 0.1 N NaOH to an endpoint, and using the volume of NaOH added, the precise concentration of NaOH can be calculated. For more information on standardizing NaOH titrant, please refer to Standard Methods 2310. To limit the amount of water being absorbed, a glass drying tube with a cotton ball inserted should be used to prevent moisture going into the tube.
- How do MANTECH systems measure and record temperature?
The standard method for measuring temperature is with a USB-connected stainless steel thermistor probe. The specifications for this probe are below:
- Communication: USB controlled by MANTECH Pro Software
- Sheath Material: Super OMEGACLAD XL/ Stainless Steel/Inconel
- Temp Range: 0 to 1038 Degree C.
- Diameter: 0.062in
- Length: 6 inch
- Measurement to 3 decimal places
- Autocalibration feature in MANTECH Pro software
Alternatively, when measuring conductivity, one can measure the temperature directly from the conductivity probe. This temperature is also displayed directly on the conductivity meter screen.
MANTECH has the ability to use either of these measurement methods for pH temperature compensation, depending on customer preference and system configuration.
MANTECH temperature sensors are available in both PT1000 and 10kNTC styles. PT1000 sensors have a linear positive-slope relationship between resistance and temperature with a resistance of 1000 ohms at 0°C, and 10kNTC sensors have a curved negative-slope relationship between resistance and temperature with a resistance of 10,000 ohms at 25°C. Both these models of temperature sensor perform well and comparably within the 0-100°C temperature range that liquid samples exist in. If you require a specific type of temperature sensor, please feel free to let MANTECH know and we will accommodate.
- How does the PeCOD benefit water treatment optimization?
A common benefit of peCOD implementation for this application is optimization of coagulant dosing.
The traditional method up to this point has been consistent dosing based on laboratory testing results (jar testing is a very common method of developing coagulant dosing requirements). They then increase their dosing for events that they know to cause NOM spikes. The problem is they often don’t know the extent of the NOM spikes, so they increase their dosing to what has been deemed as ‘enough’. More often than not this is over-dosing, not really causing downstream issues but incurring more cost than is needed for these events. However, when the extra dose is not enough and they under-dose, NOM gets through and reacts with the disinfection chemicals creating DBPs.
The missing ingredient is knowing when these NOM spikes occur, and to what extent. The events could be anything from seasonal variation based on climate to rapid spikes from storm events, but the benefit of knowing is the same. Plants that have enough funding to do so monitor UV and TOC online, however research has shown that this is not enough. peCOD is another piece of the NOM puzzle and is truly the more important measure when looking at how NOM will react and be affected by treatment. If you know the COD of the NOM coming in and can match it to known dosing requirements, you minimize the possibility of DBPs forming.
The speed and ease of use of the peCOD is also key here, you are placing this knowledge directly in the operators’ hands, rather than having it be a result they wait to get back from an external lab. When they can truly understand the technology and it’s value, it has a secondary effect of getting them more involved with optimizing the treatment processes. We see with numerous cases (mostly in WWTPs at this point) this occurring, where they get the peCOD for measuring one or two points then realizing the benefit it can have through monitoring their whole plant.
- How does the PeCOD Analyzer calculate COD?
The PeCOD Analyzer performs advanced oxidation on a small volume of sample. As the reaction proceeds, electrical charge is generated proportional to the oxygen being consumed. The PeCOD analyzer captures this generated charge, plotting the output current from the reaction over time as shown below. The area under the curve generated by plotting current over time is proportional to the COD of the sample. A blank charge is also determined for each sample, and subtracted from the total charge to ensure accuracy.
View the detailed overview of PeCOD technology and calculations here.

- What is the primary mechanism of PeCOD chemistry?
The primary driver of the peCOD method chemistry is advanced oxidation induced by photocatalysis with Titanium Dioxide (TiO2). Pure TiO2 is only photo-active at wavelengths below 380 nm. This is because a certain amount of light energy is required to bump the electrons around and cause the behaviors that we associate with photocatalysis. The UV LED in the PeCOD® COD Analyzer operates at a peak wavelength of 365 nm, with a minimum 360 nm and maximum 370 nm, ensuring that efficient photocatalysis is achieved.

- What is the difference between chemical oxygen demand and biochemical oxygen demand?
Chemical Oxygen Demand (COD) analysis is a measurement of the oxygen-depletion capacity of a water sample contaminated with organic waste matter. Specifically, it measures the equivalent amount of oxygen required to chemically oxidize organic compounds in water. The traditional COD method is the wet chemistry method, dichromate COD (CODCr). This involves a two hour digestion at high heat under acidic conditions and involves hazardous chemicals such as mercury and dichromate.
Biochemical Oxygen Demand (BOD), also often referred to as biological oxygen demand, is a test performed to measure the potential of wastewater and other waters to deplete the oxygen level of receiving waters. The BOD test involves taking an initial dissolved oxygen (DO) reading and a second reading after five days of incubation at 20°C. For this reason, this test is often written as BOD5 for short.
MANTECH has developed an automated COD method utilizing a new, rapid and green technology called the PeCOD® COD Analyzer. This method directly measures the amount of oxidizable material in a sample via photoelectrochemical oxidation in a microcell, eliminating the need for time-consuming digestion and hazardous chemicals as only an electrolyte solution is required for analysis.
- What pH range can the PeCOD method measure in?
pH Range: 4.0 – 10.0 (after mixing with electrolyte)
The peCOD method requires that the pH of a sample AFTER being mixed with electrolyte must be between 4 – 10. To determine if a sample must be pH-adjusted, mix the sample with peCOD electrolyte at the proper mixing ratio for your COD range, then test the pH of the mixture.
For example, the sample may have a pH of 3.0, but then after preparing with electrolyte, the pH is in the required range, therefore, it is acceptable for immediate peCOD measurement.
If samples have been preserved in acid, they should be neutralized using sodium hydroxide prior to analysis to avoid a low reading, as well as damage to the sensor. When the sample pH is below 4, the photocatalytic oxidation at the TiO2 sensor is affected, leading to poor reproducibility and charge values below theoretical expectation. Below a pH of 2, the TiO2 displays instability. When the pH is above 10, the charge measured for the reference and sample solution yield lower than expected values, again caused by interference at the TiO2 sensor. Sulphuric acid should be used to lower the pH of samples with a pH of 10 or more.
- How should COD samples be stored?
MANTECH recommends storing samples in the laboratory fridge vs preserving samples. If you do choose to preserve your samples, use H2SO4 to adjust the pH of your samples to ~2.
- What are the PeCOD electrolyte and calibrant solutions composed of?
The PeCOD electrolyte solution is mainly composed of a low-concentration lithium nitrate solution. The PeCOD calibrant and check standard solutions supplied by MANTECH are composed of sorbitol. These solutions contain a trade recipe preservative that allow for the longer shelf life, compared to solutions prepared manually. Calibrant and check standard solutions prepared manually, following the PeCOD Standard Recipe, can be used for up to two weeks.
View the PeCOD electrolyte slurry SDS here.
View the PeCOD calibrant slurry SDS here.
View the PeCOD QC check standard slurry SDS here.
View the PeCOD blank slurry SDS here.
- Do I need to filter my samples for PeCOD analysis?
Samples must be filtered prior to peCOD analysis to ensure that no particulates greater than 50 micron (um) are primed into the peCOD. Particulates larger than 50um can cause clogging, which can lead to damage of the internal fluidics of the machine. To prevent clogging and ensure proper sample preparation, MANTECH has a Sample Filtering Guide for PeCOD Analysis.
For pulp and paper and wastewater applications, MANTECH recommends using a 35um polyethylene (PE) syringe filter. These filters can contribute trace amounts of organics, which are negligible for wastewater applications. For drinking and source water applications it’s important to use a filter that does not contribute organics to the filtered sample. One of MANTECH’s research partners has recommended a 0.45um polyethersulfone (PES) filter; however, other filter types may also be acceptable, if no organics are contributed by the filter. Since these applications traditionally see less particulates, having a smaller pore size filter hasn’t shown an impact on the peCOD results.
- How long does it take to measure initials and finals on a MANTECH AM300 series multi-rack system?
The length of time to measure initials and finals on a MANTECH AM300 series multi-rack system varies depending on the method of sample preparation, sampler size, and probe style. For an example of a typical MANTECH BOD system click here. For an individualized estimate contact us at [email protected].
- What information is required to automate biochemical oxygen demand?
Automating the biochemical oxygen demand (BOD) test can greatly increase the efficiency and production capacity of a laboratory. To automate this analysis, the following information is required:
- How many bottles on average do you set up for an initials batch?
- For example, this accounts for all samples and all dilutions per sample, plus blanks, GGA’s, etc.
- How often do you set up Initials?
- For example, many laboratories set up Initials on Wednesday, Thursday, and Friday then Finals on Monday, Tuesday, and Wednesday since the laboratory is closed on weekends.
- What is the maximum number of bottles in your incubator at any one time?
- Do you analyze BOD, cBOD, or both?
- What is the source of most samples that you are analyzing
- For example, municipal WW, industrial WW, surface water, etc.
- What percentage of samples do you know the approximate BOD of before analysis?
- Who are the clients or users of the BOD information?
- For example, industrial pre-treatment, WWTP effluent compliance, WWTP engineers, etc.
- How many bottles on average do you set up for an initials batch?
- What are the dimensions of MANTECH BOD Autosampler Racks?
Part Number Rack Size Autosampler Model Bottle Style Depth Width Rack Height Rack Height w/ Bottles PB-10246 18 x 300mL AM400 & AM300 Series Glass 487.68 mm
19.2 inches
236.22 mm
9.03 inches
63.5 mm
2.5 inches
2.69 mm + bottle height
0.106 inches + bottle height
PB-10247 18 x 300mL AM400 & AM300 Series Plastic 487.68 mm 19.2 inches
236.22 mm 9.03 inches
63.5 mm 2.5 inches
2.69 mm + bottle height
0.106 inches + bottle height
PB-10248 12 x 300mL AM400 Series Glass 487.68 mm
19.2 inches
153.42 mm
6.04 inches
63.5 mm
2.5 inches
2.69 mm + bottle height
0.106 inches + bottle height
PB-10255 12 x 300mL AM400 & AM300 Series Plastic 487.68 mm 19.2 inches
153.42 mm 6.04 inches
63.5 mm 2.5 inches
2.69 mm + bottle height
0.106 inches + bottle height
PB-10293 12 x 300mL AM430 Series Glass 320.04 mm 12.6 inches
229.36 mm 9.03 inches
63.5 mm 2.5 inches
2.69 mm + bottle height
0.106 inches + bottle height
PB-10295 12 x 300mL AM430 Series Plastic 320.04 mm 12.6 inches
229.36 mm 9.03 inches
63.5 mm 2.5 inches
2.69 mm + bottle height
0.106 inches + bottle height
PB-10138 11 x 300mL AM73 Plastic 337 mm
13.25 inches
234 mm
9.19 inches
88 mm
3.13 inches
8 mm + bottle height
0.313 inches + bottle height
PB-10139 11 x 300mL AM73 Glass 337 mm
13.25 inches
234 mm
9.19 inches
88 mm
3.13 inches
8 mm + bottle height
0.313 inches + bottle height
PB-10162 23 x 300mL AM122 Glass 488 mm
19 inches
307 mm
12.06 inches
71 mm
3.81 inches
9.5 mm + bottle height
0.375 inches + bottle height
PB-10163 23 x 300mL AM122 Plastic 488 mm
19 inches
307 mm
12.06 inches
71 mm
3.81 inches
9.5 mm + bottle height
0.375 inches + bottle height
PB-10060 (discontinued) 24 x 300mL Glass/Plastic 485 mm
18.82 inches
315 mm
12.38 inches
193 mm
7.60 inches
5 mm + bottle height
0.188 inches + bottle height
PB-10133 (discontinued) 24 x 300mL Glass/Plastic 485 mm
18.82 inches
315 mm
12.38 inches
131 mm
5.125 inches
5 mm + bottle height
0.188 inches + bottle height
- How do I configure the YSI 4010 MultiLab IDS meter for PC-BOD?
To use the YSI 4010 MultiLab IDS meter with PC-BOD, the appropriate driver, computer settings, and software settings must be applied. Download the Technical Bulletin for more details.
- Why does the barometer reading on my YSI 4010 MultiLab IDS meter not match the reading documented by my local weather service?
The YSI MultiLab IDS meter outputs a true barometric pressure reading of its location, which is dependent on elevation above sea level.
Local weather services typically use a corrected barometric pressure reading, which corrects the reading to sea level.
To approximate the true barometric pressure reading from a corrected barometric pressure reading, use the following equation:
True barometric pressure [mmHg] = Corrected barometric pressure [mmHg] – (0.025 * local altitude [feet] )
- Can I calibrate the internal barometer on my meter?
The internal barometer on the YSI MultiLab IDS meter is calibrated upon manufacturing and is designed to last the lifespan of the barometer sensor. The sensor is very stable and can last many years. Standard Methods does not specify a requirement for an adjustable barometer for dissolved oxygen measurements or biological oxygen demand testing.
- How do I calibrate my DO probe with the YSI 4010 MultiLab IDS Meter?
Unless otherwise specified in company or site-specific procedures, specifications, and regulations, a water vapor-air saturated calibration should be sufficient for probe calibration. For full calibration procedures, please refer to the following pdf.
- How do I set the sensor cap coefficients in my YSI 4010 MultiLab IDS meter?
Follow the step-by-step instructions in the pdf.
- How do I set the date and time in my YSI 4010 MultiLab IDS Meter?
Follow the step-by-step instructions in the pdf.
- What does the Class 3B warning label on the PeCOD COD Analyzer head mean?
The PeCOD COD Analyzer has a warning label on the analyzer head “DO NOT OPEN ANALYZER LID WHILE IN OPERATION” and “CAUTION: CLASS 3B INVISIBLE LASER RADIATION. AVOID EXPOSURE TO BEAM.” See Image 1.
Image 1: Warning label on analyzer lid
There are two normal LED lights (one red, one green), and one (invisible) Class 3B UV LED laser. See Image 2.
The red LED light is an error indicator and is a non-harmful light. The green LED light is the power indicator and is also a non-harmful light.
The Class 3B UV LED laser is a catalyst for TiO2 oxidation of organics. Class 3B UV LED lasers are harmful to your health, however, there are safety measures put into place to avoid exposure to this invisible UV LED laser on the PeCOD COD Analyzer. The PeCOD has an automatic laser shut off built in so the laser will turn off when the analyzer lid is opened. This lid should not be tampered with or modified as the Class 3B laser is hazardous to your health.

Image 2: Analyzer head with 2 (two) normal LED lights, and 1 (one) 3B UV LED Laser
- Does PeCOD conform to regulatory standards?
The PeCOD conforms to regulatory standards such as the ASTM International Method D8084, the Ministry of Environment, Conservation and Parks, Ontario (MECP) method E3515, and the Health Canada Guidance on drinking water.
The ASTM International method for photoelectrochemical oxygen demand is approved for measuring organics in freshwater sources and treated drinking water. More details about this method can be viewed here.
The Ontario MECP method E3515 replaced the standard dichromate methods due to the fact that no harmful chemicals are used in the PeCOD method. This method now includes PeCOD as an approved alternate COD method in the Municipal and Industrial Strategy for Abatement (MISA). The MECP method can be viewed here.
- What is the time of analysis per parameter and for multi-parameter analysis?
The timing for analysis of different parameters depends on several different factors, like the concentration of the sample and the equipment used.
Another factor is the total available sample volume in the vessel on the AutoMax Autosampler bed. With some combinations of parameters, larger sample volume allows for simultaneous measurements, resulting in faster total analysis time than sequential measurement. A larger sample volume may require a larger sample cup, which decreases capacity on the same model Autosampler. For example, an AM73 can accommodate 73x50ml tubes, or 30x125ml cups. In some, the cases the same set of parameters can be analyzed in 2-5 minutes faster when using the 125ml cups vs 50ml tubes.
It is important to understand your requirements in terms of capacity and throughput speed, total batch capacity required and/or daily sample loads and if overnight, unattended analyses will be applicable.
Individual Parameters
Combined Parameters
MT-10 & MT-30 Models

* If alkalinity is combined with turbidity and/or colour an MT-100 System must be quoted
MT-100 Model

- What are the COD/BOD ranges for the PeCOD and what are the mixing ratios?
There are 4 COD ranges for the PeCOD. The advanced blue range is the lowest range and analyzes samples up to 25mg/L with a mixing ratio of 3:1 (sample to electrolyte). Green is the second lowest range and measures up to 150mg/L with a mixing ratio of 1:1. The yellow range determines COD up to 1,500mg/L with a mixing ratio of 1:9 and the red range can analyze samples up to 15,000mg/L and has a mixing ratio of 1:49. For more information, read MANTECH’s technical bulletin here.
- What is the allowable COD/chloride concentration combinations for PeCOD analysis?
There are limitations to ensure that, after dilution with electrolyte, the chloride concentration will be <200mg/L. This means that the allowable chloride concentration of the original sample varies depending on the COD range (as illustrated below) since each range has a different ratio of sample to electrolyte. For more information, read MANTECH’s technical bulletin here.

- What are the reasons for differences between the PeCOD COD and Dichromate COD results in some cases?
Chemical Oxygen Demand (COD) results may differ when measured via the PeCOD COD method versus the traditional dichromate COD method for certain sample matrices. There are various reasons for this difference. One is that chloride, ammonia, and some heavy metals have been known to interfere with PeCOD readings and provide inaccurate results. Another reason could be the time delays between analyses. It is best to analyze samples via PeCOD and dichromate on the same day to limit uncertainties due to sample degradation. For additional reasons and more information, read MANTECH’s technical bulletin here.
- What is the difference between the L50 and the L100?
The L50 is the newer, more cost efficient model of the PeCOD. It uses the same method, reagents, and software as the L100. Improvements were made with the fluidics and space requirement in the L50 model. For more information, see the news section.
- What is the difference between BOD and cBOD?
Biochemical oxygen demand (BOD) is a way to assess the amount of oxygen required for aerobic microorganisms to decompose the organic material in a sample of water over a specific time frame. It is the oxygen uptake demand of a source of water. Carbonaceous biochemical oxygen demand (CBOD) is the same method as BOD, but the nitrifying bacteria in the sample are inhibited. Nitrifying bacteria consume nitrogenous materials (compounds with reduced forms of nitrogen) and add to the oxygen demand of the wastewater. Nitrogenous materials are often seen as interference because the purpose of the BOD test is to measure carbonaceous material.
- How do I store my electrode block?
If only storing the electrode block for a short period of time (less than 4 weeks), rinse DI water through the PeCOD and leave the electrode block inside. Make sure all of the sample has been washed through by priming Port A several times. If storing for more than 4 weeks, put DI water through the PeCOD and then remove the electrode block to store outside the PeCOD. Flush the channels with 20-30 mL of DI water before pushing through about 10 mL of NaCl, leaving the channels filled. Tape the ends of the channels to ensure no leaks or crystallization occur. For more information, read the storage instructions here.
- How do I change the number of calibrations and QC checks the PeCOD does during each QC regime?
Click ‘File’ in the top left corner, and select ‘Preferences’. The ‘General’ tab will pop up, select the ‘QC Regimes’ tab. Here you can see how many calibrations, QC checks, and recalibrations the PeCOD® will preform for the ‘Startup (Daily) Regime’. To see the other regimes, select the ‘Startup (New Sensor)’ tab, or the ‘QC Routine’ tab in the second row. To edit the number of calibrations or QC checks, click the arrows beside the numbers to choose how many of each the PeCOD® will perform.
- How long does a sensor last in a PeCOD® Analyzer?
Sensor lifetime depends on a number of factors including frequency of use, storage conditions, nuances of certain sample matrices, and time between uses. Sensors are expected to last for approximately 150 runs (this includes samples, calibrations and QC checks), or for a minimum of 3-4 weeks when used consistently day after day. When analyzing higher sample concentrations (especially red range) the sensor life expectancy can be shorter, ranging from 60 – 150 total measurements depending on sample strength.
In cases where the PeCOD is not being used frequently (2 weeks or more between each set of samples), the sensor’s life expectancy timeline can be extended through the proper application of long-term storage recommendations. MANTECH recommends that when the PeCOD is not expected to be used for more than 2 weeks at a time, that Ports A and B should be primed with air, then the sensor be removed from the analyzer and stored in a dark, dry location with the sensor window face-down (white foam facing up). This is because moisture and light exposure are known to have a degrading effect on the sensor, reducing the lifespan of use. At the same time, the PeCOD Electrode Block should be removed and stored with DI water filling the internal liquid channels. This can be achieved by covering one of the channel outlets with laboratory tape, then use a syringe to inject DI water into the channel until it overflows out of the hole you are injecting into, and then cover that hole with tape as well.
When the PeCOD is being used more frequently, MANTECH recommends leaving the sensor in place with DI primed through Port A between analyses and running at least one QC check per day to keep the sensor “active” even on days that you are not expecting to run samples. This ensures the best day-to-day conditions for the sensor leading to the longest possible lifespan of use. On days where you are planning to run samples, a new calibration is recommended when the daily QC check does not fall within the +/- 20% passing range. It is always important to prime Port A and Port B x3 times with the proper reagents when going from DI water storage to the daily QC check and samples.
For more information, read MANTECH’s technical bulletin here.
- Will PeCOD correlate with my Dichromate COD results?
There is a strong correlation between the PeCOD COD results and the dichromate COD results. To determine this, the two methods were compared vs. the theoretical oxygen demand (ThOD) for 34 organic species. See MANTECH’s technical bulletin for more information on the study.
- How long will the PeCOD® Electrolyte, Calibrant, and Standard solutions last?
Both Calibrant and Standard Solutions are good for one year after they are made. Electrolyte has a shelf life of two years after it is produced. All labels have the expiry date in the box just above the MANTECH logo.
- How do I replace the sensor in my PeCOD® Analyzer?
Open the top plastic door by pushing down firmly on the front centre of the door until a “click” is heard, then release the door. Open the PeCOD analyzer module by pressing firmly down on the fixed bar, and lifting the front latching bar (should unlatch), then lift up the PeCOD sensor lid. Remove the old sensor by lifting it off of the pins and place the new sensor on the same pins with the “THIS SIDE UP” surface (blue side) facing you.
- What is alkalinity and how is it speciated into carbonate, bicarbonate and hydroxide fractions?
Alkalinity is the buffering capacity of a solution. It is a valuable water quality parameter used for many applications, including, but not limited to: drinking water treatment, domestic and industrial wastewater treatment, swimming pools, food and beverage, soil, agriculture, and other environmental testing.
The main compounds of alkalinity are: hydroxides (OH -), carbonates (CO3 2-), and bicarbonates (HCO3 -). The buffering capacity of a solution depends on the absorption of positively charged hydrogen ions by negatively charged bicarbonate and carbonate molecules. When bicarbonate and carbonate molecules absorb hydrogen ions, there is a shift in equilibrium without a significant shift in pH. A sample with high buffering capacity will have high bicarbonate and/or carbonate content, and a greater resistance to changes in pH.
MANTECH complies with EPA Method 310.1, ASTM Method D 1067-92, and Standard Method 2320, for determining alkalinity, which calculates the concentrations of OH -, CO3 2-, and HCO3 -. Total alkalinity is calculated as the sum of these three species and is expressed in units of milligrams of calcium carbonate per litre (mg CaCO3/L).
The alkalinity method involves titrating samples with a titrant of known concentration, commonly, 0.02N sulphuric acid (H2SO4), to pH endpoints of 8.3 and 4.5. The alkalinity calculated up to endpoint 8.3 is classified as phenolphthalein alkalinity (palk), whereas the alkalinity calculated up to endpoint 4.5 is classified as total alkalinity (talk). A titration curve is generated by plotting pH versus volume of dispensed titrant (Figure 1).

Figure 1: Sample titration curve for a 100ppm alkalinity sample
The titration curve is used to determine the volume of dispensed titrant at each endpoint. To calculate palk, the following equation is used:
𝑝𝑎𝑙𝑘=𝑥𝑣𝑜𝑙(8.3)× 𝑡𝑐𝑜𝑛×50 000/𝑠𝑣𝑜𝑙
Where:
𝑥𝑣𝑜𝑙(8.3)=𝑣𝑜𝑙𝑢𝑚𝑒 𝑜𝑓 𝑡𝑖𝑡𝑟𝑎𝑛𝑡 𝑢𝑠𝑒𝑑 𝑡𝑜 𝑡𝑖𝑡𝑟𝑎𝑡𝑒 𝑡𝑜 𝑝𝐻 8.3 (𝑚𝐿)
𝑡𝑐𝑜𝑛=𝑛𝑜𝑟𝑚𝑎𝑙𝑖𝑡𝑦 𝑜𝑓 𝑡𝑖𝑡𝑟𝑎𝑛𝑡(𝑁) 50 000= 𝑒𝑞𝑢𝑖𝑣𝑎𝑙𝑒𝑛𝑡 𝑤𝑒𝑖𝑔ℎ𝑡 𝑜𝑓 𝐶𝑎𝐶𝑂3 𝑎𝑠 𝑑𝑒𝑓𝑖𝑛𝑒𝑑 𝑖𝑛 𝑆𝑡𝑎𝑛𝑑𝑎𝑟𝑑 𝑀𝑒𝑡ℎ𝑜𝑑𝑠 (𝑚𝑔/𝑚𝑜𝑙)
𝑠𝑣𝑜𝑙=𝑣𝑜𝑙𝑢𝑚𝑒 𝑜𝑓 𝑠𝑎𝑚𝑝𝑙𝑒 𝑡𝑖𝑡𝑟𝑎𝑡𝑒𝑑 (𝑚𝐿)
talk is calculated using the following equation:
𝑡𝑎𝑙𝑘= 𝑥𝑣𝑜𝑙(4.5)× 𝑡𝑐𝑜𝑛× 50 000/𝑠𝑣𝑜𝑙
Where:
𝑥𝑣𝑜𝑙(4.5)=𝑣𝑜𝑙𝑢𝑚𝑒 𝑜𝑓 𝑡𝑖𝑡𝑟𝑎𝑛𝑡 𝑢𝑠𝑒𝑑 𝑡𝑜 𝑡𝑖𝑡𝑟𝑎𝑡𝑒 𝑡𝑜 𝑝𝐻 4.5 (𝑚𝐿)
𝑡𝑐𝑜𝑛=𝑛𝑜𝑟𝑚𝑎𝑙𝑖𝑡𝑦 𝑜𝑓 𝑡𝑖𝑡𝑟𝑎𝑛𝑡 (𝑁)
50 000= 𝑒𝑞𝑢𝑖𝑣𝑎𝑙𝑒𝑛𝑡 𝑤𝑒𝑖𝑔ℎ𝑡 𝑜𝑓 𝐶𝑎𝐶𝑂3 𝑎𝑠 𝑑𝑒𝑓𝑖𝑛𝑒𝑑 𝑖𝑛 𝑆𝑡𝑎𝑛𝑑𝑎𝑟𝑑 𝑀𝑒𝑡ℎ𝑜𝑑𝑠 (𝑚𝑔/𝑚𝑜𝑙)
𝑠𝑣𝑜𝑙=𝑣𝑜𝑙𝑢𝑚𝑒 𝑜𝑓 𝑠𝑎𝑚𝑝𝑙𝑒 𝑡𝑖𝑡𝑟𝑎𝑡𝑒𝑑 (𝑚𝐿)
For samples with talk less than 20ppm, a low alkalinity titration procedure requires the sample to be titrated to a pH of 4.3, as per Standard Method 2320. To calculate talk of low alkalinity samples, the following equation is used:
𝑡𝑎𝑙𝑘= (2 × 𝑥𝑣𝑜𝑙(4.5)−𝑥𝑣𝑜𝑙(4.2)) × 𝑡𝑐𝑜𝑛× 50 000/𝑠𝑣𝑜𝑙
Where:
𝑥𝑣𝑜𝑙(4.5)=𝑣𝑜𝑙𝑢𝑚𝑒 𝑜𝑓 𝑡𝑖𝑡𝑟𝑎𝑛𝑡 𝑢𝑠𝑒𝑑 𝑡𝑜 𝑡𝑖𝑡𝑟𝑎𝑡𝑒 𝑡𝑜 𝑝𝐻 4.5 (𝑚𝐿)
𝑥𝑣𝑜𝑙(4.2)=𝑣𝑜𝑙𝑢𝑚𝑒 𝑜𝑓 𝑡𝑖𝑡𝑟𝑎𝑛𝑡 𝑢𝑠𝑒𝑑 𝑡𝑜 𝑡𝑖𝑡𝑟𝑎𝑡𝑒 𝑡𝑜 𝑝𝐻 4.2 (𝑚𝐿)
𝑡𝑐𝑜𝑛=𝑛𝑜𝑟𝑚𝑎𝑙𝑖𝑡𝑦 𝑜𝑓 𝑡𝑖𝑡𝑟𝑎𝑛𝑡 (𝑁)
50 000=𝑒𝑞𝑢𝑖𝑣𝑎𝑙𝑒𝑛𝑡 𝑤𝑒𝑖𝑔ℎ𝑡 𝑜𝑓 𝐶𝑎𝐶𝑂3 𝑎𝑠 𝑑𝑒𝑓𝑖𝑛𝑒𝑑 𝑖𝑛 𝑆𝑡𝑎𝑛𝑑𝑎𝑟𝑑 𝑀𝑒𝑡ℎ𝑜𝑑𝑠 (𝑚𝑔/𝑚𝑜𝑙)
𝑠𝑣𝑜𝑙=𝑣𝑜𝑙𝑢𝑚𝑒 𝑜𝑓 𝑠𝑎𝑚𝑝𝑙𝑒 𝑡𝑖𝑡𝑟𝑎𝑡𝑒𝑑 (𝑚𝐿)
The values for talk and palk can be used to determine the concentrations of OH-, CO32, and HCO3-, and indicate the following conditions:
1. OH – alkalinity is present if palk is greater than half of the talk
2. CO3 2- alkalinity is present when palk is not zero, but is less than talk
3. HCO3 – ions are present if palk is less then half the talkTable 1 shows the calculations for determining the concentration of each species of alkalinity based on the results for palk and talk.

Table 1: Alkalinity species calculationsMANTECH’s MT Series automates alkalinity and low alkalinity measurements, following EPA, ASTM, ISO and Standard Methods. For more information on how MANTECH can simplify your alkalinity analysis, refer to the MT Series product info page or contact your local MANTECH distributor.
For more information on MANTECH’s method for automated alkalinity measurement and how the species of alkalinity are calculated, download the pdf.
- How is the PeCOD® COD/BOD Analyzer calibrated?
Calibrations are comprised of 6 different stages. The first stage is called the “Normalization Phase” and lasts 100 seconds. During this time, the LED strength is adjusted to maintain a baseline electrical current of 20 mA. This is performed on the blank solution, containing range specific electrolyte and COD free deionized water. Once the LED is set, oxidation of the blank solution will occur. This is comprised of 3 stages, visualized by 3 distinct curves. The stages are known as the Burn-In, Pre-Burn, and Oxidation of port B. The blank acts as a zero reference for the calibration based on the charge generated from the DI and electrolyte mixture. The area under the curve is used to quantify charge. Once the Port B stages have completed, the Port A stages will begin. The calibrant and electrolyte mixture is introduced across the TiO2 sensor, where similar Pre-Burn and Oxidation curves are generated. The concentration of the calibrant is determined based on the sample COD/BOD range. Once the specified number of calibrations have completed, the calibrant solution can be run as a sample (referred to as a QC check). It is expected that the COD result will be + / – 5% of the standard COD/BOD value. To view an example of the stages of a PeCOD® calibration, view our video &list=PLLCp3SOh3VUis3EGUiMonY7KV28v4bwGM&index=7″>here.
- What is Gran analysis and why is Gran alkalinity important?
Gran analysis is an effective alternative method for endpoint and pKa detection. Using a series of mathematical manipulations, standard titration curves are transformed into linear data called ‘Gran functions’. Endpoints and pKa’s are determined by performing a linear regression on these functions. In many cases, Gran analysis provides a more accurate endpoint, or identifies endpoints not evaluated in Standard Methods.
- Why does KHP measure high on PeCOD?
KHP (Potassium Hydrogen Phthalate) has historically been a common reference standard used in a variety of chemistry applications including the traditional dichromate COD test, where it does provide a result close to the theoretical COD result, and for TOC analysis. KHP is not recommended for use in the PeCOD COD analysis as it over reports compared to the theoretical COD amount. This is predominantly due to some pre-concentration of the molecule on the surface of the PeCOD sensor prior to analysis which is a peculiarity of KHP with the PeCOD COD method.
It is important to note that for all COD methods there are specific molecules whereby the individual analytical result is not well aligned to the theoretical value. For instance, organic compounds such as propionic acid, diethylamine or nicotinic acid could not be used as a COD standard for the dichromate COD method due to poor correlation to theoretical results but could be suitable for the PeCOD COD method. It is therefore important to chose a standard that provides a strong correlation to the theoretical result for the method employed, is a good reflection of the samples to be analysed, is suitable for general laboratory use and is readily available. For details on preparing sorbitol and glucose-based COD standards for the PeCOD COD method, read our technical bulletin 2017-029: PeCOD Standard Recipe.
- What is the cost per sample using the PeCOD?
On average, the cost per sample can range anywhere from $2.44-$3.00 per sample. The cost per sample varies depending on the COD/BOD range and the number of samples analyzed, as this affects consumable usage such as calibrant, electrolyte and sensors. In general, the cost per sample decreases with an increase in the number of samples. There are several reasons for this, one being that the sensor should be replace monthly, therefore running more samples per month will yield a better return on sensor usage. In addition, the PeCOD® requires a daily calibration; by running more samples per calibration users save on consumable costs associated with calibrant. There are no disposal costs for the PeCOD, whereas disposal costs accumulate via the traditional dichromate method with every sample vial.

*All prices in USD
- How do inorganic compounds affect PeCOD® COD determination?
The following tables summarize the impact of a range of common inorganic anions and cations on the determination of COD using the PeCOD® technique. You can download this FAQ as a pdf document at this link.
For each inorganic species, solutions containing 0, 20, 50, 100, 250, 500 ppm (by mass) of the anion or cation, 60ppm COD (as sorbitol) and 1M LiNO3 (containing 20ppm COD spike) were prepared and analyzed, unless otherwise stated. Therefore, the below ion concentrations represent the concentration IN THE CELL (i.e. if analyzed in a different range, the interference levels may vary due to different electrolyte dilution effects).
Anions Formula Remark Ammonium NH4+ No interference for NH4+ ≤ 500 ppm Note: Similar results are obtained for Ammonia
Carbonate CO32- No interference for CO32- ≤ 500ppm using chloride resistant sensor Chlorate ClO3– No interference for ClO3– ≤ 500ppm Chloride Cl– Chloride ions interfere with COD readings in concentrations greater than 200mg/L. The COD is expected to be reduced by up to 20% when levels exceed 500mg/L. Samples with high chloride concentrations can still be run on the PeCOD. The allowable chloride concentration of the sample varies depending on the COD range being run on the PeCOD. When diluting a sample to be within the acceptable chloride concentrations, the dilution must occur prior to mixing with electrolyte. The different allowable Chloride ion concentrations are:
- Advanced Blue: 266mg/L
- Green: 400mg/L
- Yellow: 2000mg/L
- Red: 10,000 mg/L.
Other halides like fluoride, bromide, and iodide are expected to have similar concentrations and interference behaviours.
Nitrate NO3– No interference, NO3– can be used as PeCOD electrolyte Nitrite NO2– No interference for NO2– ≤ 500ppm Perchlorate ClO4– No interference, ClO4– can be used as PeCOD electrolyte Phosphate PO43- No interference for PO43- ≤ 500ppm Sulfate SO42- No interference for SO42- ≤ 500ppm Sulfite SO32- Interference for SO3 ≥ 20 ppm, giving COD high by 90% at 250 ppm SO32- Sulfide S2- Interference for S2- > 0 ppm, giving COD high by >100% at 50 ppm S2- Cations Formula Remark Aluminum Al3+ No interference for Al3+ ≤ 500ppm Calcium Ca2+ No interference for Ca2+ ≤ 500ppm Chromate Cr3+ Interference for Cr3+ > 2 ppm, giving low COD Ferric Iron Fe3+ No interference for Fe3+ ≤ 500ppm Ferrous Iron Fe2+ Interference for Fe2+ > 100 ppm, giving low COD Magnesium Mg2+ No interference for Mg2+ ≤ 500ppm Potassium K+ No interference for K+ ≤ 500ppm Silver Ag+ Interference for Ag+ > 10 ppm, giving low COD Sodium Na+ No interference for Na+ ≤ 500ppm Zinc Zn2+ No interference for Zn2+ ≤ 500ppm - My conductivity meter is not communicating with PC-Titrate. What can I do to troubleshoot?
Checking the interface communication and software settings is a good place to start when troubleshooting a conductivity meter which has lost communication.